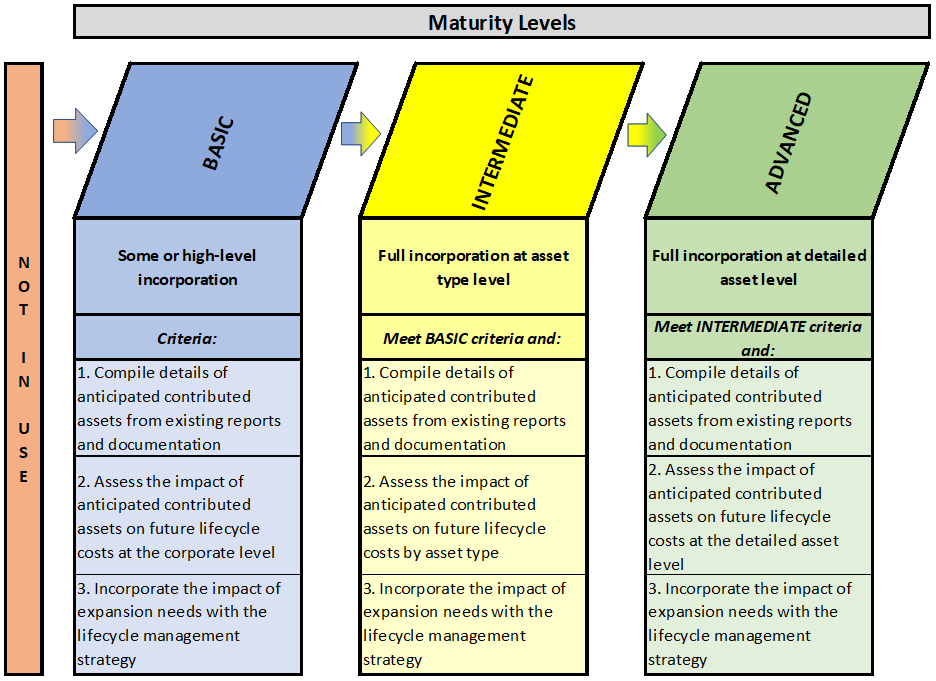
This framework is intended for municipalities of all sizes
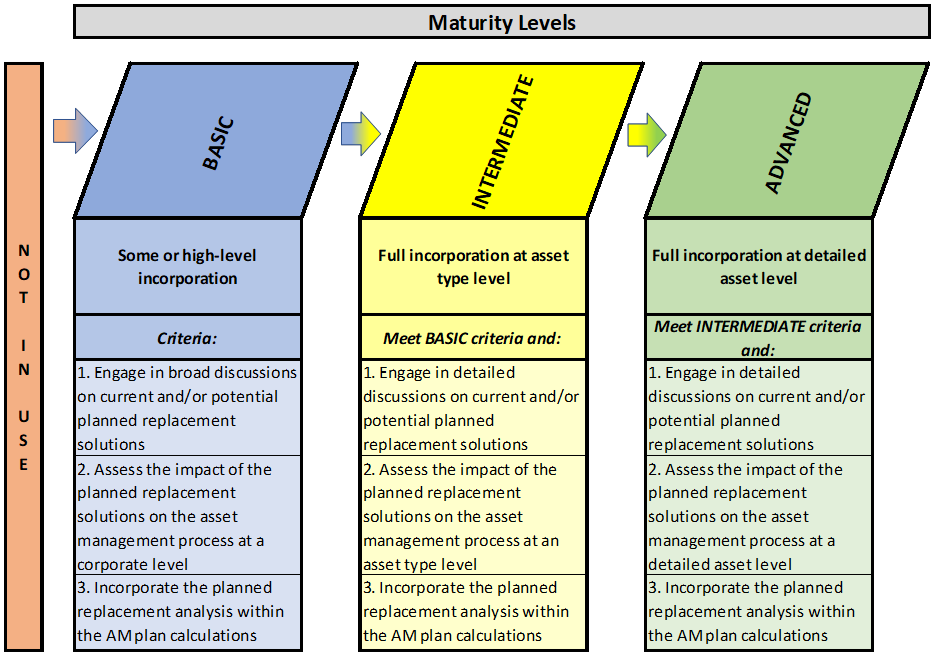
and maturity levels. The use of the maturity diagrams within this framework can
help municipalities identify their current levels of maturity for each AM area.
In addition, the diagrams provide possible approaches for municipalities to
undertake in order to move to a higher level of maturity over time. Adaptations
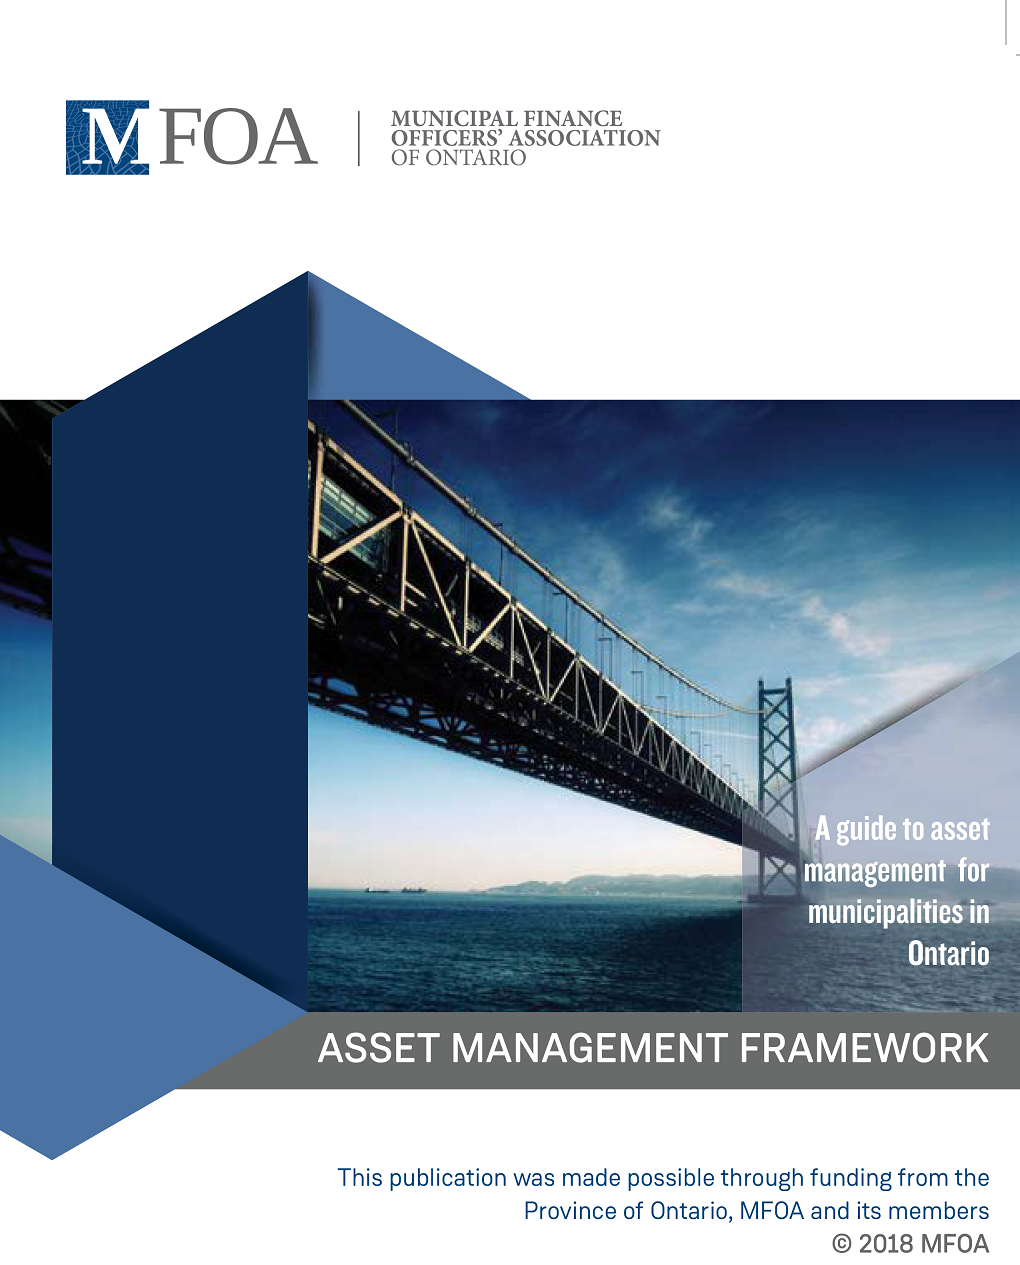
of the following diagram are used throughout this document to summarize
maturity levels according to the themes and questions explored in each chapter: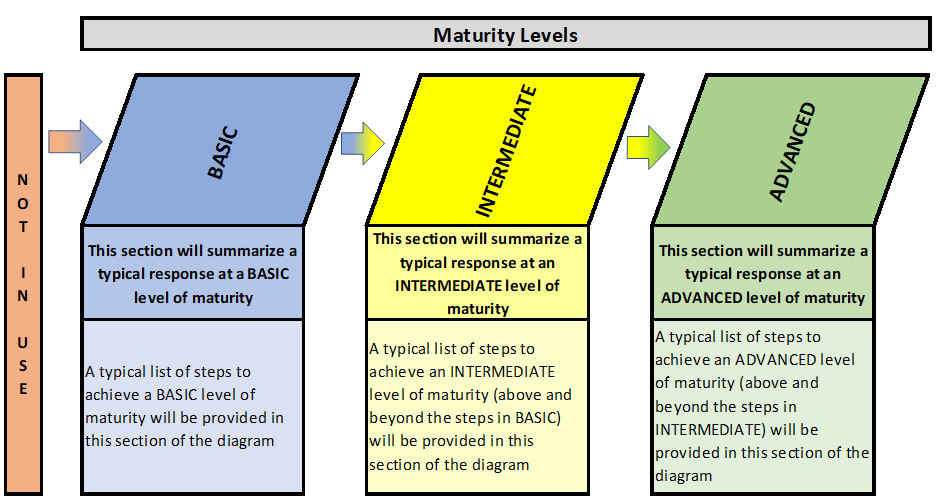
Municipalities that are not undertaking the components
described in a particular section of this framework should focus on meeting the
basic level requirements outlined in the maturity level diagram.
At the basic level of maturity, a municipality is
undertaking the components of asset management shown in blue and will take
steps to advance their asset management by implementing the components
described under the intermediate level heading.
At the intermediate level of maturity, a municipality
is currently meeting the requirements shown in yellow and to advance their
asset management will take steps to implement the components described under
the advanced level heading.
At the advanced level of maturity, a municipality is
currently meeting the requirements shown in green.
These maturity framework visuals are found throughout this
document. Preceding all maturity level diagrams is a self-assessment question
for the reader to consider to help determine where their municipality best fits
within the framework.
5.2
Overview
The Ontario “Building Together Guide for Municipal Asset
Management Plans” defines an asset management strategy as:
The set of planned actions that will enable the
assets to provide the desired levels of service in a sustainable way, while
managing risk, at the lowest lifecycle cost.
Moving forward, the “asset management strategy” will be
referred to as the “lifecycle management strategy”, which provides a more
accurate description of the requirements in this section. The actions defined
and identified within the lifecycle management strategy detail how assets
should be maintained, renewed/rehabilitated, replaced, disposed, or expanded
upon. All strategies considered will attempt to move the municipality towards
expected levels of service in an efficient and effective manner.
Lifecycle Costing
Lifecycle costing is defined by IIMM as:
The total cost of an asset throughout its life
including planning, design, construction, acquisition, operation, maintenance,
rehabilitation and disposal costs.
Within this is the true challenge of public infrastructure
management which is:
To ensure that the assets we have now and those
that will be created in the future provide suitable levels of service at a cost
the community can afford.
Lifecycle costing is comprised of the following costs over
an asset’s useful life:
·
Acquisition or construction;
·
Operating;
·
Maintaining;
·
Rehabilitating;
·
Replacing;
·
Disposing; and
·
Non-infrastructure solutions.
All of the cost elements above should be considered when
determining the true cost of an asset over its useful life. The resulting cost
profile may look something like the following figure.
Figure 5‑1
Sample Asset Cost Profile
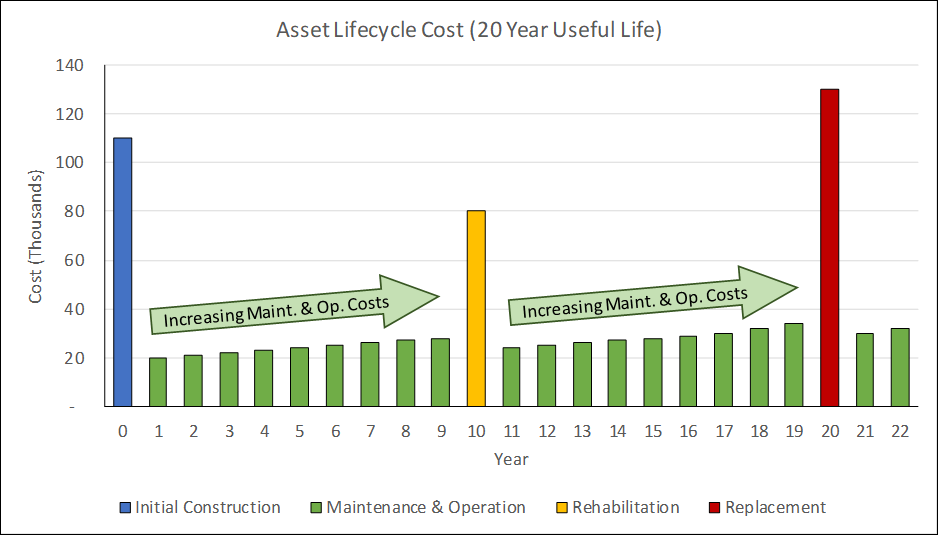
Figure 5-1 (above) illustrates:
·
Initial construction of the asset occurs in year 0;
·
Maintenance and operational costs are incurred annually,
increasing as the asset deteriorates (from year 1 to 9);
·
Rehabilitation of the asset is shown in year 10, which has the
result of extending the remaining useful life of the asset and reducing annual
maintenance and operational costs;
·
Maintenance and operational costs are incurred annually,
increasing as the asset deteriorates (from year 11 to 19);
·
Complete asset replacement occurs in year 20; and
·
Annual maintenance and operational costs continue forward on the
new asset.
Asset managers strive to achieve the lowest lifecycle cost
for all assets. The example described above provides an indication of the total
lifecycle cost by summing all annual costs over the asset’s life. Comparing
alternative lifecycle scenarios, such as alternative interventions and
frequencies, allows municipalities to experiment with the impact of differing
lifecycle forecasts on the assets themselves and the services being provided.
This methodology will be expanded upon further in later sections within this
chapter.
Infrastructure for Jobs and Prosperity (IJPA) Act and O.
Reg 588/17 Requirements
O.Reg 588/17 outlines the
following requirements with respect to the Lifecycle Management Strategy:
Every municipality shall prepare an asset management plan in
respect of its core municipal infrastructure assets by July 1, 2021, and
in respect of all of its other municipal infrastructure assets by July 1,
2023.
A municipality’s AM plan must
include the following (for each asset category):
a) The lifecycle
activities that would need to be undertaken to maintain the current levels of
service for each of the 10 years following the year for which the current
levels of service are determined and the costs of providing those activities
based on an assessment of the following:
i.
The full lifecycle of the assets.
ii.
The options for which lifecycle activities could potentially be
undertaken to maintain the current levels of service.
iii.
The risks associated with the options referred to in subparagraph ii.
iv.
The lifecycle activities referred to in subparagraph ii that can be
undertaken for the lowest cost to maintain the current levels of service.
b) For
municipalities with a population of less than 25,000, as reported by Statistics
Canada in the most recent official census, the following:
i.
A description of assumptions regarding future changes in population or
economic activity.
ii.
How the assumptions referred to in subparagraph i relate to the required
lifecycle activities described above.
c) For
municipalities with a population of 25,000 or more, as reported by Statistics
Canada in the most recent official census, the following:
i.
With respect to municipalities in the Greater Golden Horseshoe growth
plan area, if the population and employment forecasts for the municipality are
set out in Schedule 3 or 7 to the 2017 Growth Plan, those forecasts.
ii.
With respect to lower-tier municipalities in the Greater Golden
Horseshoe growth plan area, if the population and employment forecasts for the
municipality are not set out in Schedule 7 to the 2017 Growth Plan, the portion
of the forecasts allocated to the lower-tier municipality in the official plan
of the upper-tier municipality of which it is a part.
iii.
With respect to upper-tier municipalities or single-tier municipalities
outside of the Greater Golden Horseshoe growth plan area, the population and
employment forecasts for the municipality that are set out in its official
plan.
iv.
With respect to lower-tier municipalities outside of the Greater Golden
Horseshoe growth plan area, the population and employment forecasts for the
lower-tier municipality that are set out in the official plan of the upper-tier
municipality of which it is a part.
v.
If, with respect to any municipality referred to in subparagraph iii or
iv, the population and employment forecasts for the municipality cannot be
determined as set out in those subparagraphs, a description of assumptions
regarding future changes in population or economic activity.
vi.
For each of the 10 years following the year for which the current levels
of service are determined, the estimated capital expenditures and significant
operating costs related to the lifecycle activities required to maintain the
current levels of service in order to accommodate projected increases in demand
caused by growth, including estimated capital expenditures and significant
operating costs related to new construction or to upgrading of existing
municipal infrastructure assets.
By July 1, 2024, every asset
management plan must include the following additional information:
a) A lifecycle
management and financial strategy that sets out the following information with
respect to the assets in each asset category for the 10-year period:
i.
An identification of the lifecycle activities that would need to be
undertaken to provide the proposed levels of service described in paragraph 1,
based on an assessment of the following:
A.
The full lifecycle of the assets.
B.
The options for which lifecycle activities could potentially be
undertaken to achieve the proposed levels of service.
C.
The risks associated with the options referred to in sub-subparagraph B.
D.
The lifecycle activities referred to in sub-subparagraph B that can be
undertaken for the lowest cost to achieve the proposed levels of service.
ii.
An estimate of the annual costs for each of the 10 years of undertaking
the lifecycle activities identified in subparagraph i, separated into capital
expenditures and significant operating costs.
iii.
An identification of the annual funding projected to be available to
undertake lifecycle activities and an explanation of the options examined by
the municipality to maximize the funding projected to be available.
iv.
If, based on the funding projected to be available, the municipality
identifies a funding shortfall for the lifecycle activities identified in
subparagraph i,
A.
an identification of the lifecycle activities, whether set out in
subparagraph i or otherwise, that the municipality will undertake, and
B.
if applicable, an explanation of how the municipality will manage the
risks associated with not undertaking any of the lifecycle activities identified
in subparagraph i.
b) For
municipalities with a population of less than 25,000, as reported by Statistics
Canada in the most recent official census, a discussion of how the assumptions
regarding future changes in population and economic activity informed the
preparation of the lifecycle management and financial strategy.
c) For
municipalities with a population of 25,000 or more, as reported by Statistics
Canada in the most recent official census,
i.
the estimated capital expenditures and significant operating costs to
achieve the proposed levels of service as described in paragraph 1 in order to
accommodate projected increases in demand caused by population and employment
growth, as set out in the forecasts or assumptions referred to in paragraph 6
of subsection 5 (2), including estimated capital expenditures and significant
operating costs related to new construction or to upgrading of existing
municipal infrastructure assets,
ii.
the funding projected to be available, by source, as a result of
increased population and economic activity, and
iii.
an overview of the risks associated with implementation of the asset
management plan and any actions that would be proposed in response to those
risks.
To what extent are non-infrastructure solutions incorporated
into the lifecycle management strategy?
Background
Cost reduction is a consistent driver across most
municipalities, and the same is true for asset management. Investment in municipal
assets is subject to limited funding, so if the same outcome can be produced at
a lower cost, more can be done with the funding that is available. At the same
time, care must be taken to ensure that a cost reduction today does not result
in a cost escalation in the future.
Non-infrastructure solutions are actions or policies that
are not capital in nature, which result in the lowering of costs and/or extend
the useful life of an asset.
Levels of Maturity
To what extent are non-infrastructure solutions
incorporated into the lifecycle management strategy?
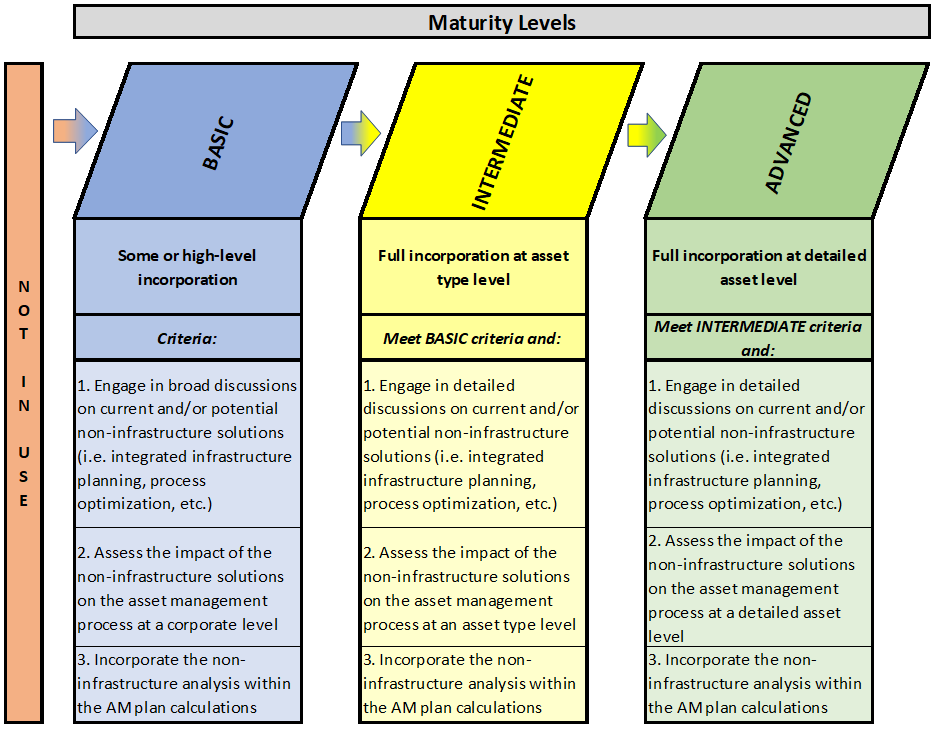
At the basic level of maturity, non-infrastructure
solutions are incorporated into the lifecycle management strategy to some
extent. Municipalities may engage in broad discussions on current and/or
potential non-infrastructure solutions. The impact of these solutions on the
asset management process would be assessed at a corporate level. Finally, the
non-infrastructure analysis are incorporated within the asset management plan
calculations.
At the intermediate level of maturity,
non-infrastructure solutions are incorporated fully into the lifecycle
management strategy at the asset level. Municipalities may engage in detailed
discussions on current and/or potential non-infrastructure solutions. The
impact of these solutions on the asset management process is assessed at an
asset level. Finally, the non-infrastructure analysis is incorporated within
the asset management plan calculations.
At the advanced level of maturity, non-infrastructure
solutions are incorporated fully into the lifecycle management strategy at a
detailed asset level. Municipalities may engage in detailed discussions on
current and/or potential non-infrastructure solutions. The impact of these
solutions on the asset management process is assessed at a detailed asset
level. Finally, the non-infrastructure analysis is incorporated within the
asset management plan calculations.
Non-Infrastructure
Solutions Introduction
Non-infrastructure solutions include policies, processes, or
strategies that:
·
Reduce asset related costs (i.e. operating, maintaining,
rehabilitation, replacement, expansion); and/or
·
Improve asset performance (resulting in lower costs and/or
extended life).
Achieving cost reduction can come down to effective and
efficient non-infrastructure solutions for asset management:
·
Effectiveness involves “doing what should be done”, in terms of
policies, processes, or strategies. This can come from best practices,
legislation, or direction provided by policy, process, or strategy.
·
Efficiency involves utilizing the policies, processes, and
strategies in the best possible way.
Examples of non-infrastructure solutions
include:
Table 5‑1
Sample Non-Infrastructure Solutions
|
Solution
|
Example
|
|
Integrated Infrastructure Planning
|
Layering road, water, wastewater, and stormwater capital
forecasts together. This ensures newly paved roads don’t have to be dug up
for main replacements.
|
|
Land Use Planning
|
Manage the development of land within the municipality, ensuring
an efficient use of land and the efficient construction of assets.
|
|
Demand Management
|
Manage and forecast the demand for services within
the municipality (e.g. introduce HOV lanes, offer discounts for using
facilities at non-peak hours, etc.).
Prepare a Development Charge Background Study to manage growth.
|
|
Insurance
|
Minimize unforeseen and uncontrollable asset costs through the use
of insurance policies.
|
|
Process Optimization
|
Optimization of asset management related processes,
such as “levels of service impacts” and “determining a capital forecast”.
Optimizing these processes not only minimizes the time and resources required
to complete them, but also generates more accurate and “real time” results.
Undertake Water/Wastewater/Storm Rate Study.
|
|
Managed Failures
|
Use of asset condition, risk assessments, and levels of service to
manage and plan for where assets are “allowed” to fail, allowing available
funds to be used in more critical areas.
|
|
Procurement Policies
|
Streamline purchasing policies/by-law to increase the receipt of
competitive bids for asset purchase or construction, including the ability to
tender for “build/own/operate” agreements or “public private partnerships”.
Streamlined purchasing policies assists municipalities in getting more for
the funding that is available (i.e. pave 5 km of roads per year rather than 4
km, for the same price, given the competitive bid environment).
|
Non-infrastructure solutions can
be implemented at a high (corporate) level, at the asset type level, or at the
detailed asset level. The level at which the solutions are implemented depends
on the municipality’s level of asset management maturity as well as the type of
solution being implemented. Examples of non-infrastructure solutions are shown
in Table 5-2 (below):
Table 5‑2
Non-Infrastructure Solutions Implementation
Levels
|
Maturity Level
|
Implementation Level
|
Non-Infrastructure Solution Example
|
|
Basic
|
Corporate
(High Level)
|
Strategic Plan (asset management section), outlining corporate
mission, goals, and action items from an asset management perspective.
|
|
Intermediate
|
Asset Type Level
|
Setting an enhanced procurement policy specifically for
roads-related projects.
|
|
Advanced
|
Detailed Asset Level
|
Asset Condition/Needs Study outlining specific actions by detailed
asset, asset segment, or asset component.
|
What method is used to incorporate non-infrastructure
solutions into the lifecycle management strategy?
Background
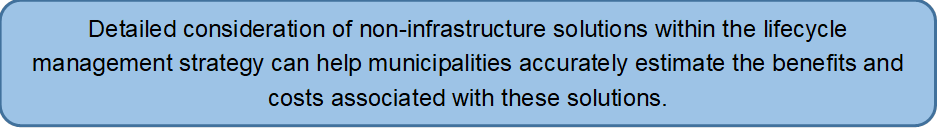
Non-infrastructure solutions may be incorporated into the
lifecycle management strategy based on past historical practices or a more
forward-looking approach where consideration of cost efficiencies and/or impact
on asset remaining life is factored into the chosen solution(s).
Levels of Maturity
What method is used to incorporate non-infrastructure
solutions into the lifecycle management strategy?
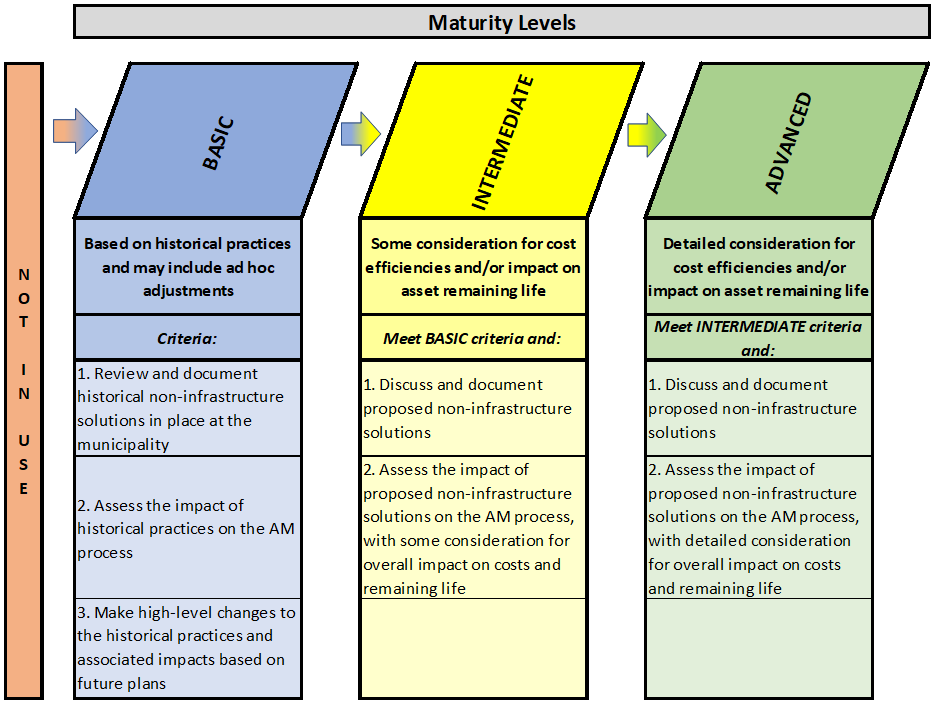
At the basic level of maturity, municipalities will
review and document historical non-infrastructure solutions that are in place.
Municipalities will tend to incorporate non-infrastructure solutions into the
lifecycle management strategy based on historical practices and may include
subsequent ad hoc adjustments based on expected revisions to historical
practices. The impact of these practices on the asset management process are
assessed.
At the intermediate level of maturity, municipalities
give some consideration to the impact of non-infrastructure solutions on cost
efficiencies and/or impact on asset remaining life. Proposed non-infrastructure
solutions are discussed and documented at a staff level. The impact of these
solutions on the asset management process are assessed, with some consideration
for the overall impact on costs and remaining life.
At the advanced level of maturity, municipalities
give detailed consideration for cost efficiencies and/or impact on asset
remaining life within a comprehensive non-infrastructure solutions analysis.
Proposed non-infrastructure solutions are discussed and documented within this
analysis. The impact of these solutions on the asset management process is
assessed, with detailed consideration for the overall impact on asset-related
costs and remaining life.
Non-Infrastructure
Solutions Methodology
Section 5-3 (above) introduced non-infrastructure solutions with
the following examples:
·
Integrated infrastructure planning;
·
Land use planning;
·
Demand management;
·
Effective use of insurance;
·
Process optimization;
·
Managed asset failures; and
·
Procurement policies.
This section discusses the process and methods of incorporating
non-infrastructure solutions into the asset management planning process. There
are two impacts of non-infrastructure solutions for municipalities to consider:
1. Projecting the
cost of implementing the non-infrastructure solution; and
2. Projecting the
cost savings or extended asset life due to implementing the non-infrastructure
solution.
Table 5-3 (below) provides examples of how
non-infrastructure solutions can be summarized from cost and savings
perspectives.
From a cost perspective, many non-infrastructure solutions
will have ongoing and/or periodic costs throughout a forecast period, such as
study or staff costs to implement integrated infrastructure planning or process
optimization. If these costs are required every few years then the long-term
forecast should reflect this need.
From a savings or asset life perspective, an estimation of
the potential savings of each non-infrastructure solution is needed. This could
be a one-time savings, but it’s likely to have a more long-term impact.
Table 5‑3
Sample Non-Infrastructure Solutions – Cost/Savings
|
Non-Infrastructure Solution
|
Cost
|
Savings
|
|
Managed Asset Failures: Condition and
Risk Assessments for all Assets
|
$50,000 every 3 years
|
10-year capital forecast decreases from $50 million
(inflated) to $45 million (inflated)
Pick-up Truck useful life extended from 7 years to 10 years
|
|
Procurement Policies: Introduce
processes to increase the number of competitive bids received
|
$20,000 one-time study cost in 2018
$5,000 annual increase in advertising
|
Pave 5 km roads per year vs. 4 km per year currently
5% reduction in salt and sand contract
|
|
Process Optimization: Automate and
optimize the capital forecast, using asset management software
|
$70,000 one-time cost for implementation and training, plus
$20,000 annual software fee
|
Remaining service life (avg.) of assets increases
from 34 years to 48 years
Infrastructure gap anticipated to be eliminated in 7 fewer years
than anticipated
|
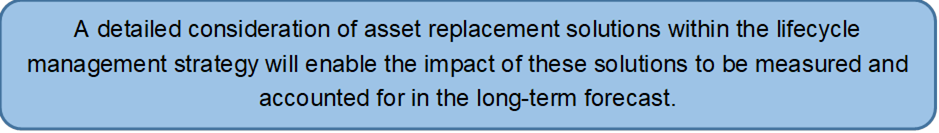
Once this costing analysis is
completed, the results can be used to inform the overall lifecycle management
strategy and be combined with other lifecycle costs anticipated over the
forecast period.
To what extent are planned maintenance solutions
incorporated into the lifecycle management strategy?
Background
Municipalities will approach planned maintenance solutions
in a number of ways. Some might base their plans on historical practices or
broad discussions at the corporate level (i.e. more high level), while others might
engage in more detailed discussions with a focus on maintenance by asset type,
or possibly at a detailed asset level.
Levels of Maturity
To what extent are planned maintenance solutions
incorporated into the lifecycle management strategy?
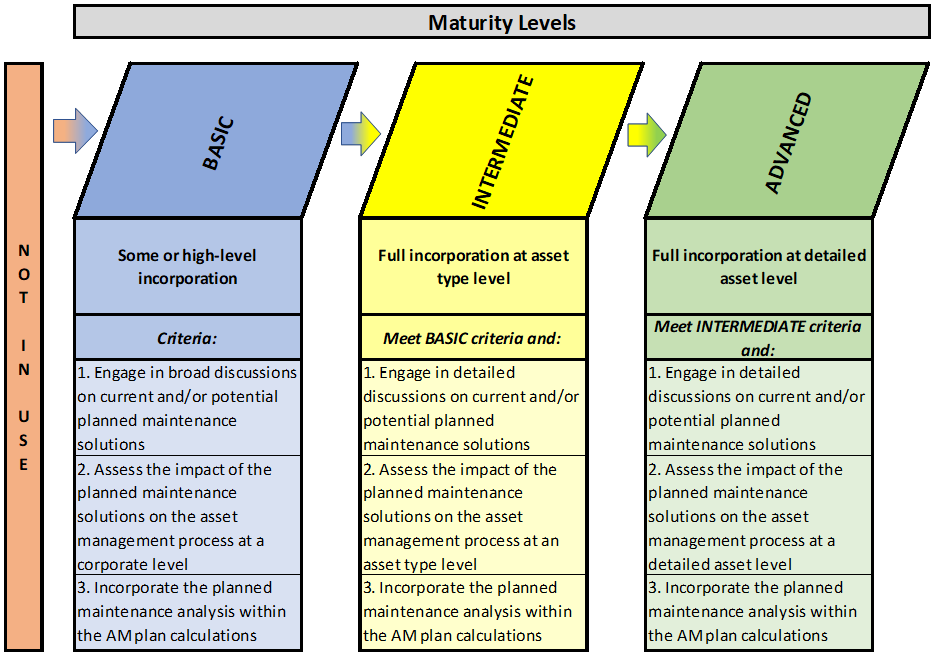
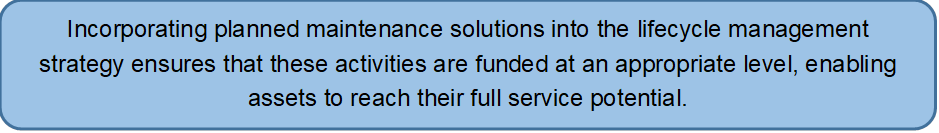
At the basic level of maturity, there will be some
incorporation or high-level incorporation of planned maintenance solutions into
the lifecycle management strategy. Municipalities engage in broad discussions
on current and/or potential planned maintenance solutions. The impact of these
solutions on the asset management process is assessed at a high level. Finally,
the planned maintenance analysis is incorporated within the asset management
plan calculations.
At the intermediate level of maturity, there will be
full incorporation of planned maintenance solutions into the lifecycle
management strategy by asset type. Municipalities engage in detailed
discussions on current and/or potential planned maintenance solutions at a
staff level. The impact of these solutions on the asset management process is
assessed by asset type. Finally, the planned maintenance analysis is
incorporated within the asset management plan calculations.
At the advanced level of maturity, there will be full
incorporation of planned maintenance solutions into the lifecycle management
strategy at a detailed asset level. Municipalities engage in detailed
discussions on current and planned maintenance solutions over a long-term
forecast period. The impact of these solutions on the asset management process is
assessed at a detailed asset level. Finally, the planned maintenance analysis is
incorporated within the asset management plan calculations.
Maintenance vs.
Rehabilitation
Maintenance solutions from an asset management perspective
includes regularly scheduled costs to inspect or maintain assets, or in some
cases, one-time repair costs that don’t meet the definition of
capital/rehabilitation. Section 3150 of the PSAB handbook provides an approach
to identify repairs and maintenance versus rehabilitation or “betterments” as
follows:
Non-Complex Network Assets (Facilities, Vehicles,
Equipment, Land Improvements):
Service potential is enhanced (i.e. costs should be
capitalized as rehabilitation) when:
·
There is an increase in previously assessed output or service
capacity;
·
Operating costs are lowered;
·
Useful life is extended; or
·
The quality of output is improved (if applicable).
Complex Network Assets (Roads, Watermains, Wastewater
mains, Stormwater Mains):
Service potential is enhanced (i.e. costs should be
capitalized as rehabilitation) when:
·
There is an increase in previously assessed output or service
capacity. This may or may not increase the useful life of the applicable
assets.
To reiterate, the maintenance activities for complex network
assets – which are assets that form a network pattern – are those that maintain
the predetermined service potential of the applicable assets. This practice is
in place to ensure a maintenance activity (such as road-related pothole filling
or crack sealing) is recorded as maintenance, rather than recorded as
rehabilitation (i.e. capital). Even though pothole filling and crack sealing can
increase the remaining life of a road, these types of activities do not
increase the previously assessed service capacity.
Historical
Maintenance
Municipalities might first review historical maintenance
data as they begin to consider the appropriate level of planned maintenance to
undertake over a forecast period. The historical data may lead to a number of
question related to spending patterns, such as:
·
Is this the correct level of spending?
·
Should spending levels be higher or lower, and if so, on which
criteria should these decisions be based?
·
Where should the focus be for planned maintenance spending?
·
What has been the impact of historical maintenance on our assets?
If a municipality can assess the impact of current
maintenance activities on service levels (through asset condition and risk), it
can be determined whether the extent of those maintenance activities is
acceptable going forward over the forecast period, or if changes are required.
This will be discussed further in the next section.
The collection of historical maintenance data within the
asset register (see Chapter 3) can provide key data to assist in developing
future maintenance strategies. Areas of concern can be uncovered, providing a
basis for developing priorities. For example, assets may be identified that
required high maintenance historically, or the assets are experiencing
increasing maintenance costs over time, which may be supported by a declining
condition rating. It is incumbent upon municipalities to identify these types
of assets in order to be in the best position to direct resources and attention
where most needed. For example, a decision might be made to continue to
maintain the asset, which may require increasing the maintenance budget.
Conversely, a decision might be made to rehabilitate or replace the asset,
which could reduce future projected maintenance.
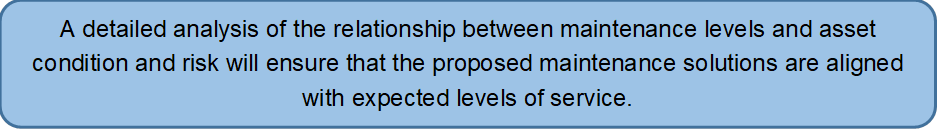
Maintenance Impact
on Assets
The decision to revise historical maintenance levels should
be made following an analysis of all lifecycle costs and expected levels of
service. For example, if an asset is not meeting expected levels of service,
the municipality will need to determine the lifecycle costs necessary to reach
those expected levels. These costs might include maintenance adjustments and,
potentially, other lifecycle costs (such as rehabilitation and replacement). Based
on a municipality’s maturity level, this can be done using a more high-level
(corporate) approach, a more intermediate asset type approach, or a more
detailed asset approach. Examples are provided in Table 5‑4 (below).
Table 5‑4
Sample Maintenance Solutions – Levels of Maturity
|
Maturity Level
|
Levels of Service Comments
|
Maintenance Impact
|
|
Basic
|
Assets as a whole are not meeting expected service levels
|
Increase all maintenance by 5% per year and monitor impact on
service levels annually
|
|
Intermediate
|
One particular asset type is not meeting expected service levels
|
Increase maintenance programs from $500,000 to $1.2 million over
10 years to provide expected levels of service (can be increases to existing
programs or new programs)
|
|
Advanced
|
One particular asset is not meeting expected service levels
|
Increase maintenance programs from $5,000 to $12,000 over 10 years
to provide a specific expected service level (can be increases to existing
programs or new programs)
|
What method is used to incorporate planned maintenance
solutions into the lifecycle management strategy?
Background
Municipalities engage in a number of approaches to determine
how much maintenance should be carried out in a given year. A simple approach
may be to base maintenance spending on prior years’ operating budgets, apply an
inflationary increase, and adjust for any necessary ad hoc adjustments for ‘out
of the ordinary’ or ‘new’ spending. Other municipalities will undertake a more
detailed approach, taking into account the condition of their assets, risk
levels, and desired levels of service to be provided.
Levels of Maturity
What method is used to incorporate planned maintenance
solutions into the lifecycle management strategy?
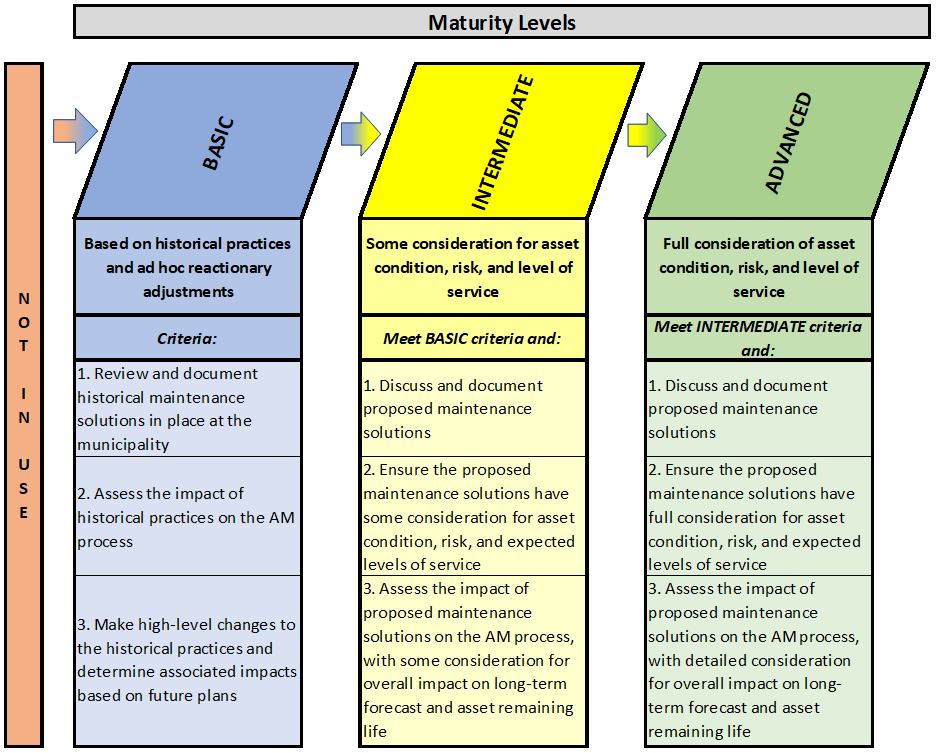
At the basic level of maturity, municipalities will
tend to incorporate planned maintenance solutions into the lifecycle management
strategy based on historical practices and may include subsequent ad hoc
adjustments. These municipalities will review and document historical
maintenance solutions that are in place. The impact of these practices on the
asset management process is assessed. Past practices are updated with any
high-level changes included in future maintenance plans. The associated impacts
of these changes is determined and considered for use in the budgeting process.
At the intermediate level of maturity, municipalities
incorporating planned maintenance into their lifecycle management strategy give
some consideration to asset condition, risk, and levels of service. Proposed
maintenance solutions are discussed and documented. Municipalities ensure the
proposed maintenance solutions will lead to some improvement in asset
condition, risk, and levels of service. The impact of these solutions on the
asset management process is assessed, with some consideration for the overall
impact on the long-term forecast and the assets’ remaining life.
At the advanced level of maturity, municipalities
incorporating planned maintenance into their lifecycle management strategy give
full consideration to asset condition, risk, and levels of service. Proposed
maintenance solutions are discussed and documented. Municipalities ensure the
proposed maintenance solutions fully take into account impacts on asset
condition, risk, and levels of service. The impact of these solutions on the
asset management process is assessed, with detailed consideration for the
overall impact on the long-term forecast and the assets’ remaining life.
Planned Maintenance
Strategy
This section introduces the concept of a “planned
maintenance strategy”, which identifies the role of planned maintenance in the
asset management planning process. Maintenance decisions should be made in consideration
with other lifecycle costs (i.e. rehabilitation and replacement), and be based
on factors such as:
·
Asset condition;
·
Asset risk; and
·
Expected levels of service.
Through this decision-making process the municipality will
need to answer:
Does maintenance provide an improvement in asset
condition, a mitigation of risk, and/or a movement towards expected levels of
service in an efficient and effective manner?
And,
Does maintenance defer other lifecycle costs to the point
where savings are projected?
These questions become more complicated when other lifecycle
costs are brought into the equation. Finding the optimal level of maintenance,
rehabilitation, and replacement lifecycle costs over a forecast period is the
definition of lifecycle optimization. Weighing the lifecycle costs against the
potential improvement in condition, mitigation of risk, and movement towards
expected service levels becomes the ultimate goal within the lifecycle
management strategy.
While planned maintenance should be integrated into
the asset management process, unplanned maintenance should be discussed
as well. Significant and dramatic increases in asset risk, even to the point of
asset failure, can represent a need for unplanned maintenance. While one of the
objectives of asset management planning is to minimize these events, they are
not completely avoidable. In the case of asset failure, municipalities will
need to assess whether the best strategy is to:
·
Perform maintenance work;
·
Rehabilitate;
·
Replace the asset;
·
Apply non-infrastructure solutions; or
·
Do nothing (i.e. allow the asset to continue to fail).
While considering the strategies above, municipalities need
to decide whether to base planned maintenance on historical trends or develop
new maintenance strategies that take risk and/or asset condition into account.
Either way, lifecycle costs should be quantified as part of the lifecycle
management strategy as well as the impact on the assets themselves. (i.e.
useful life, condition, risk, etc.).
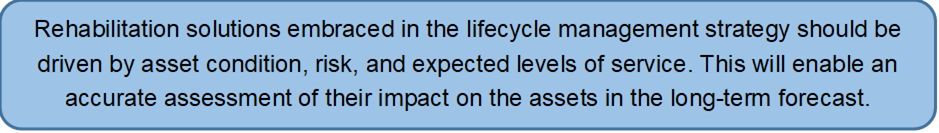
To what extent are planned rehabilitation solutions
incorporated into the lifecycle management strategy?
Background
Municipalities will approach planned rehabilitation
solutions in a number of ways. Some will base their plans on broad discussions
at the corporate level, whereas others will engage in more detailed discussions
with a focus on the asset type, or even at a detailed asset level.
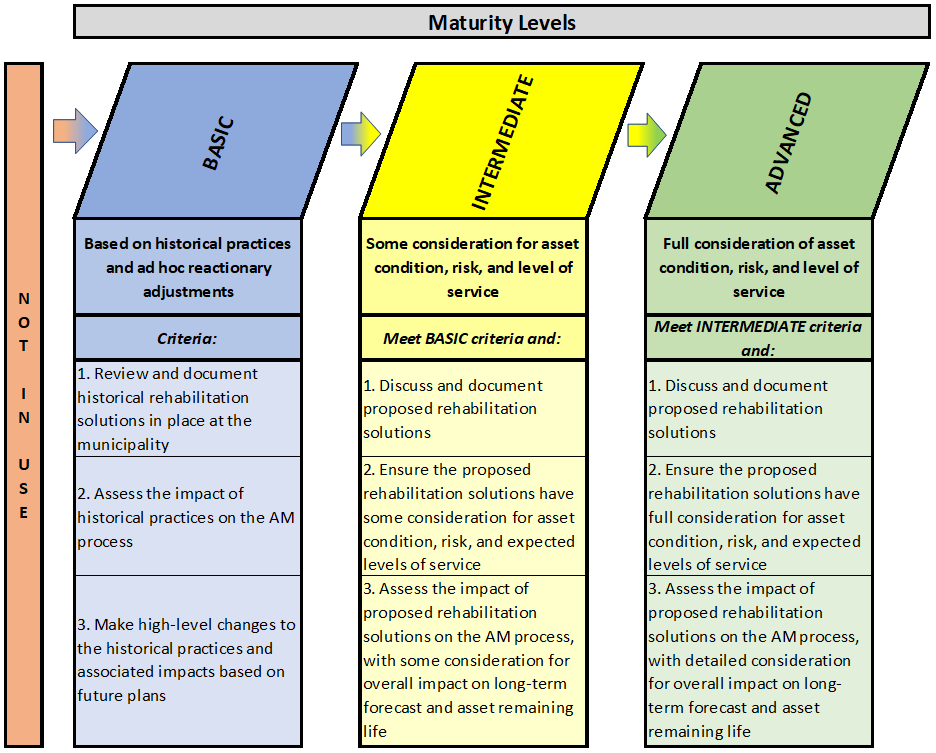
Levels of Maturity
To what extent are planned rehabilitation solutions
incorporated into the lifecycle management strategy?

At the basic level of maturity, there will be some
high-level incorporation of planned rehabilitation solutions into the lifecycle
management strategy. Municipalities at the basic level of maturity engage in
broad discussions on current and/or potentially new planned rehabilitation
solutions. The impact of these solutions on the asset management process is
assessed at a corporate level. Finally, the planned rehabilitation analysis is
incorporated within the asset management plan calculations.
At the intermediate level of maturity, there will be
full incorporation of planned rehabilitation solutions into the lifecycle
management strategy at the asset type level. Municipalities engage in detailed
discussions on current and potential planned rehabilitation solutions to be
incorporated over the forecast period. The impact of these solutions on the
asset management process is assessed at the asset type level. Finally, the planned
rehabilitation analysis is incorporated within the asset management plan
calculations.
At the advanced level of maturity, there will be full
incorporation of planned rehabilitation solutions into the lifecycle management
strategy at a detailed asset level. Municipalities engage in detailed
discussions on current and potential planned rehabilitation solutions. The
impact of these solutions on the asset management process is assessed at a
detailed asset level. Finally, the planned rehabilitation analysis is
incorporated within the asset management plan calculations.
Rehabilitation vs.
Maintenance
Rehabilitation from an asset management perspective includes
significant repairs that, in many cases, extend asset life. Section 3150 of the
PSAB handbook provides an approach to identify rehabilitation (or
“betterments”) versus repairs and maintenance, as follows:
Non-Complex Network Assets (Facilities, Vehicles,
Equipment, Land Improvements):
Service potential is enhanced (i.e. costs should be
capitalized as rehabilitation) when:
·
There is an increase in previously assessed output or service
capacity;
·
Operating costs are lowered;
·
Useful life is extended; or
·
The quality of output is improved (if applicable).
Complex Network Assets (Roads, Watermains, Wastewater
mains, Storm Mains):
Service potential is enhanced (i.e. costs should be
capitalized as rehabilitation) when:
·
There is an increase in previously assessed output or service
capacity. This may or may not increase the useful life of the applicable
assets.
To reiterate, complex network assets – which are assets that
form a network pattern – rehabilitation activities increase the predetermined
service potential while maintenance activities simply maintain the
predetermined service potential of the applicable assets. This practice is in
place to ensure rehabilitation activities such as the lining of wastewater
mains are recorded as rehabilitation (i.e. capital). Conversely, maintenance
activities such as road-related pothole filling or crack sealing, should be
recorded as maintenance, rather than be identified as rehabilitation (i.e.
capital). Although pothole filling and crack sealing could increase the
remaining life of a road, these solutions do not increase the previously
assessed service capacity.
Historical
Rehabilitation
Municipalities might first review historical rehabilitation
data as they begin to consider the appropriate level of planned rehabilitation
to undertake over a forecast period. The historical data may lead to a number
of question related to spending patterns, such as:
·
Is this the correct level of spending?
·
Should spending levels be higher or lower, and if so, on which
criteria should these decisions be based?
·
Where should the focus be for planned rehabilitation spending?
·
What has been the impact of historical rehabilitation on our
assets?
If a municipality can assess the impact of current
rehabilitation practices on service levels (through asset condition and risk),
it can determine whether the extent of those rehabilitation practices is
acceptable going forward over the forecast period, or if changes are required.
This will be discussed further in Section 5.7.
As discussed in Section 5.5, the collection of historical
maintenance data within the asset register (see Chapter 3) can provide key data
to assist in developing future rehabilitation strategies. Areas of concern can
be uncovered, providing a basis for developing priorities. For example, assets
may be identified that required high maintenance historically, or the assets
are experiencing increasing maintenance costs over time, which may be supported
by a declining condition rating. It is incumbent upon municipalities to
identify these assets and be in the best position to direct resources and
attention where most needed. For example, the decision could be made to
continue to maintain the asset, which requires increasing the maintenance
budget. Conversely, the decision could be made to rehabilitate or replace the
asset, which could reduce future projected maintenance.
Rehabilitation
Impact on Assets
The decision to revise historical rehabilitation levels
should be made through an analysis of all lifecycle costs, based on expected
levels of service. For example, if an asset is not meeting expected levels of
service, the lifecycle costs needed to reach those levels must be determined.
This could include rehabilitation and, potentially, other lifecycle costs (such
as maintenance and replacement). Based on a municipality’s maturity level, this
can be done using a more high-level (corporate) approach, a more intermediate
asset type approach, or a more detailed asset approach. Examples are provided
in Table 5‑5 below:
Table 5‑5
Sample Rehabilitation Impacts
|
Maturity Level
|
Levels of Service Comments
|
Rehabilitation Impact
|
|
Basic
|
Assets as a whole are not meeting expected service levels
|
Increase all rehabilitation programs by 5% per year and monitor
impact on service levels annually for impact
|
|
Intermediate
|
One particular asset type is not meeting expected service levels
|
Increase rehabilitation from $1.0 million to $2.0 million over 10
years to provide expected levels of service (can be increases to existing
programs or new programs)
|
|
Advanced
|
One particular asset is not meeting expected service levels
|
Increase rehabilitation on specific asset over forecast period to
provide a specific expected service level (can be increases to existing
programs or new programs)
|
What method is used to incorporate planned rehabilitation
solutions into the lifecycle management strategy?
Background
Municipalities engage in a number of approaches to
incorporate planned rehabilitation solutions into the lifecycle management
strategy. A simple approach may be to base rehabilitation solutions on
historical practices, then incorporate any necessary ad hoc adjustments for
unexpected situations as they arise. Other municipalities may undertake a more
detailed approach, taking into account the condition of their assets, risk
levels, and desired levels of service to be provided.
Levels of Maturity
What method is used to incorporate planned rehabilitation
solutions into the lifecycle management strategy?
At the basic level of maturity, municipalities will
tend to incorporate planned rehabilitation solutions into the lifecycle management
strategy based on historical practices and may include subsequent ad hoc
reactionary adjustments. Municipalities will review and document historical
rehabilitation solutions that are in place. The impact of these practices on
the asset management process is assessed. Past practices are updated with any
high-level changes included in future rehabilitation plans. The associated
impacts of these changes is determined and considered for use in the budgeting
process.
At the intermediate level of maturity, municipalities
incorporating planned rehabilitation into their lifecycle management strategy
would give some consideration to asset condition, risk, and levels of service.
Proposed rehabilitation solutions are discussed at a staff level and
documented. Municipalities ensure the proposed rehabilitation solutions lead to
some improvement in asset condition, risk, and levels of service. The impact of
these solutions on the asset management process is assessed, with some
consideration for the overall impact on the long-term forecast and the assets’
remaining life.
At the advanced level of maturity, municipalities
incorporating planned rehabilitation into their lifecycle management strategy
give full consideration to asset condition, risk, and levels of service.
Proposed rehabilitation solutions are discussed at a staff level and
documented. Municipalities ensure the proposed rehabilitation solutions take
into account asset condition, risk, and levels of service. The impact of these
solutions on the asset management process is assessed, with detailed
consideration for the overall impact on the long-term forecast and the assets’
remaining life.
Planned
Rehabilitation Solutions - Approaches
Rehabilitation of certain assets can be appropriate when the
asset is not maintaining or moving towards expected service levels but is not
at a point in its lifecycle where replacement or maintenance is the optimal
course of action. To determine appropriate planned rehabilitation solutions for
the future, municipalities can follow different approaches. There are generally
three broad categories for rehabilitation:
1.
Top down
Under the top down approach, historical rehabilitation programs would be used
as a guide for future capital works. For example, municipalities may initiate “shave
and pave” programs for some of their roads at a budgeted annual cost and would
forecast continuing the program for a number of years. Similarly, a wastewater
main relining program may be undertaken over a number of years. Taking these
programs into account, municipalities would consider any adjustments to the
programs or whether to add new programs. The municipality should assess the
impact of these programs on the impacted assets’ remaining useful life,
replacement timelines, and the service being provided over time as the program
adjustments take effect. Example:
Figure 5‑2
Sample Rehabilitation Solutions – Top Down Approach

2.
Predictive modelling
The predictive modelling approach can be undertaken by municipal staff through
an analysis of a set of planned actions that account for predicted effects on
the assets and levels of service. This can be done at a broad level (by asset
type) or at a detailed level (by detailed asset). While this can be attempted
in spreadsheet format, asset management software would make this approach
easier to implement. See Chapter 9 for further discussions on software as an
asset management tool.
Figure 5‑3
Sample Rehabilitation Solutions – Predictive Modelling
Approach
3.
Bottom up
The bottom up approach is dependent on the identification of specific assets
that require attention (i.e. consider specific asset risk ratings, condition
ratings, and service levels). Assets identified would be scheduled for
rehabilitation, with the impacts on the assets’ remaining useful life and
replacement timelines once again considered. Complex predictive modelling can
assist with this process but is not required.
Figure 5‑4
Sample Rehabilitation Solutions – Bottom Up Approach

To put these categories in context of asset management
maturity:
Table 5‑6
Sample Planned Rehabilitation Approaches – Level of Maturity
|
Maturity Level
|
Categories
|
Approach
|
|
Basic
|
Top Down Approach at Corporate Level
|
High-Level Rehabilitation Analysis (Corporate Level)
Increase rehabilitation on all assets by 10%
|
|
Intermediate
|
Top Down or Predictive Modelling
at the Asset Type Level
|
Rehabilitation at the Asset Type Level
Increase rehabilitation on local roads by 10%
|
|
Advanced
|
Bottom Up or Predictive Modelling
at the Detailed Asset Level
|
Rehabilitation at the Detailed Asset Level
Increase rehabilitation on Smith St. by 10%
|
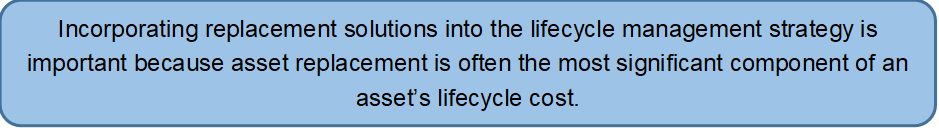
To what extent are planned replacement solutions
incorporated into the lifecycle management strategy?
Background
There are a number of ways that municipalities can approach
planned replacement solutions. Some may base their plans on broad discussions
at the corporate level, while others may engage in more detailed discussions
with a focus on the asset type, or even at a detailed asset level.
Levels of Maturity
To what extent are planned replacement solutions
incorporated into the lifecycle management strategy?
At the basic level of maturity, there will be some
high-level incorporation of planned replacement solutions into the lifecycle
management strategy. Municipalities engage in broad discussions on current and
potentially new planned replacement solutions to incorporate into the forecast.
The impact of these solutions on the asset management process is assessed at a
corporate level. Finally, the planned replacement analysis is incorporated
within the asset management plan calculations.
At the intermediate level of maturity, there will be
full incorporation of planned replacement solutions into the lifecycle
management strategy at the asset level. Municipalities engage in detailed
discussions on current and potential planned replacement solutions. The impact
of these solutions on the asset management process is assessed at an asset type
level. Finally, the planned replacement analysis is incorporated within the
asset management plan calculations.
At the advanced level of maturity, there will be full
incorporation of planned replacement solutions into the lifecycle management
strategy at a detailed asset level. Municipalities engage in detailed
discussions on current and potential planned replacement solutions. The impact
of these solutions on the asset management process is assessed at a detailed
asset level. Finally, the planned replacement analysis is incorporated within
the asset management plan calculations.
Replacement Program
Contrary to maintenance and rehabilitation identification,
the recognition of an asset being replaced is relatively straightforward. With
maintenance and rehabilitation, it will need to be determined whether the
predetermined service potential should be changed to classify a cost as
maintenance or rehabilitation (see Sections 5.5 and 5.6). Asset
replacement simply entails replacing one asset with another. The replacement
asset will either provide the same service potential or a completely different
service. Please refer to the discussion in Chapter 3 regarding the difference
between the reproduction cost and replacement cost of an asset.
Municipalities might first review historical replacement
levels undertaken over a forecast period. The historical data may lead to a
number of questions related to spending patterns, including:
·
Is this the correct level of spending?
·
Which criteria should drive decisions regarding spending levels?
·
Where should the focus be for planned replacement spending?
·
What has been the impact of historical replacement spending on
our assets?
If a municipality can assess the impact of current
replacement practices on service levels (through asset condition and risk), a
determination can be made regarding whether that level of replacement is
acceptable going forward over the forecast period, or if changes are required.
This analysis can also happen at the specific asset level, assessing
replacement needs on an asset-by-asset basis. This will be discussed further in
the next section.
As discussed in Sections 5.6 and 5.7, the collection of
historical maintenance data within the asset register (see Chapter 3) can
provide key insights to assist in the development of future replacement
strategies. Areas of concern can be uncovered, providing a basis for developing
priorities. For example, assets may be identified that required high
maintenance historically, or the assets are experiencing increasing maintenance
costs over time, which may be supported by a declining condition rating. It is
incumbent upon municipalities to identify such assets and be in the best
position to direct resources and attention where most needed. For example, the
decision could be made to continue to maintain the asset, which requires
increasing the maintenance budget. Conversely, the decision could be made to
rehabilitate or replace the asset, which could reduce future projected
maintenance.
Replacement Impact
on Assets
The decision to update historical replacement levels or
patterns to suit present and future needs should be based on an analysis of all
lifecycle costs and expected levels of service. For example, if a particular
asset is not meeting levels of service expectations, the lifecycle costs to be
incurred to move that asset towards providing expected service levels will need
to be determined. This could include replacement and potentially other
lifecycle costs (such as maintenance and rehabilitation). Based on the maturity
level of the municipality, this can be done using a more high-level (corporate)
approach, a more intermediate asset type approach, or a more detailed asset
approach. Table 5-7 provides examples of replacement impacts.
Table 5‑7
Sample Replacement Impacts – Level of Maturity
|
Maturity Level
|
Levels of Service Comments
|
Replacement Impact
|
|
Basic
|
Assets as a whole are not meeting expected service levels
|
Increase all replacement programs by 5% per year and monitor
impact on service levels annually
|
|
Intermediate
|
One particular asset type is not meeting expected service levels
|
Increase replacement program from $5.0 million to $9.0 million
over 10 years to provide an expected level of service
|
|
Advanced
|
One particular asset is not meeting expected service levels
|
Increase replacement on specific asset over forecast period to
provide a specific expected service level
|
What method is used to incorporate planned replacement
solutions into the lifecycle management strategy?
Background
Municipalities engage in a number of approaches to
incorporate planned replacement solutions into the lifecycle management
strategy. A simple approach may be to base replacement solutions on historical
practices, with any necessary ad hoc adjustments for unexpected situations as
they arise. Other municipalities may undertake a more detailed approach, taking
into account the condition of their assets, risk levels, and expected levels of
service to be provided.
Levels of Maturity
What method is used to incorporate planned replacement
solutions into the lifecycle management strategy?

At the basic level of maturity, municipalities will
tend to incorporate planned replacement solutions into the lifecycle management
strategy based on historical practices and may include subsequent ad hoc
reactionary adjustments. Municipalities will review and document historical
replacement solutions that are in place. The impact of these practices on the
asset management process is assessed. Past practices are updated with any
high-level changes included in future replacement plans. The associated impacts
of these changes is determined and considered for use in the budgeting process.
At the intermediate level of maturity, municipalities
incorporating planned replacement into their lifecycle management strategy
would give some consideration to asset condition, risk, and levels of service.
Proposed replacement solutions are discussed at a staff level and documented. Municipalities
ensure the proposed replacement solutions lead to some improvement in asset
condition, risk, and levels of service. The impact of these solutions on the
asset management process is assessed, with some consideration for the overall
impact on the long-term forecast and the assets’ remaining life.
At the advanced level of maturity, municipalities
incorporating planned replacement into their lifecycle management strategy
would give full consideration to asset condition, risk, and levels of service.
Proposed replacement solutions are discussed at a staff level and documented. Municipalities
ensure the proposed replacement solutions have full consideration for asset
condition, risk, and levels of service. The impact of these solutions on the
asset management process is assessed, with detailed consideration for the
overall impact on the long-term forecast and the assets’ remaining life.
Planned Replacement
Solutions - Approaches
Replacement of assets can be appropriate when the asset is
not maintaining or moving towards expected service levels and has reached a
point in its lifecycle where rehabilitation or maintenance are no longer
optimal courses of action. In determining appropriate planned replacement
solutions for the future, municipalities can follow different approaches
(similar to the approaches identified for rehabilitation solutions above).
There are generally three broad categories:
1.
Top down
Under the top down approach, historical replacement programs would be used as a
guide for future capital works. For example, municipalities may initiate a road
surface replacement program for their roads at a budgeted annual cost, and
would forecast continuing the program for a number of years in the forecast.
Similarly, a wastewater main replacement program may be undertaken over a
number of years. Taking these programs into account, municipalities would
consider any adjustments to the programs or whether to add new programs. The
municipality should assess the impact of these programs on the impacted assets’
remaining useful life, replacement timelines, and the service being provided
over time as the program adjustments take effect. Example:
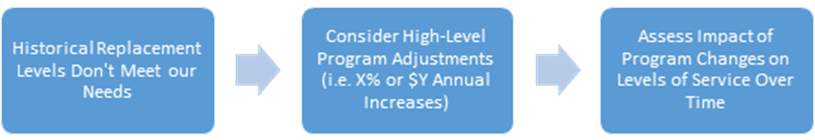
Figure 5‑5
Sample Replacement Solutions – Top Down Approach
2.
Predictive modelling
The predictive modelling approach can be undertaken by municipal staff through
an analysis of a set of planned actions that account for predicted effects on
the assets and levels of service. This can be done at a broad level (by asset
type) or at a detailed level (by detailed asset). While this can be attempted
in spreadsheet format, asset management software would make this approach
easier to implement. See Chapter 9 for further discussions on software as an
asset management tool.
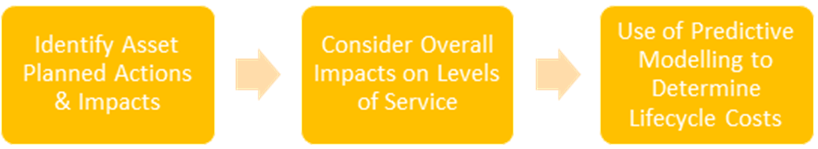
Figure 5‑6
Sample Replacement Solutions – Predictive Modelling
Approach
3.
Bottom up
The bottom up approach is dependent on the identification of specific assets
that require attention (i.e. consider specific asset risk ratings, condition
ratings, and service levels). Assets identified would be scheduled for
replacement, with the impacts on the assets’ remaining useful life, and
replacement timelines once again considered. Complex predictive modelling can
assist with this process but is not required.
Figure 5‑7
Sample Replacement Solutions – Bottom Up Approach
To put these categories in context of asset management
maturity:
Table 5‑8
Sample Planned Replacement Solutions – Level of Maturity
|
Maturity Level
|
Categories
|
Approach
|
|
Basic
|
Top Down Approach at Corporate Level
|
High-Level Replacement Analysis (Corporate Level)
Increase replacement on all assets by 10%
|
|
Intermediate
|
Top Down or Predictive Modelling
at the Asset Type Level
|
Replacement at the Asset Type Level
Increase replacement on local roads by 10%
|
|
Advanced
|
Bottom Up or Predictive Modelling
at the Detailed Asset Level
|
Replacement at the Detailed Asset Level
Increase replacement on Smith St. by 10%
|
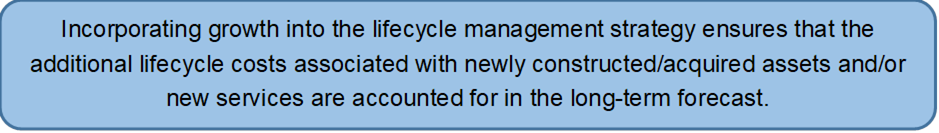
To what extent are growth and/or new service areas
incorporated into the lifecycle management strategy?
Background
Municipalities can approach the incorporation of growth
and/or new service areas in a number of ways. After compiling expansion needs
from existing reports and documentation, some will assess the impacts on
funding sources but only at the corporate level; some may take it a step
further by assessing impact on funding sources by service type area; whereas
others will go further still and assess impact on funding sources at the
detailed project level.
Levels of Maturity
To what extent are growth and/or new service areas
incorporated into the lifecycle management strategy?
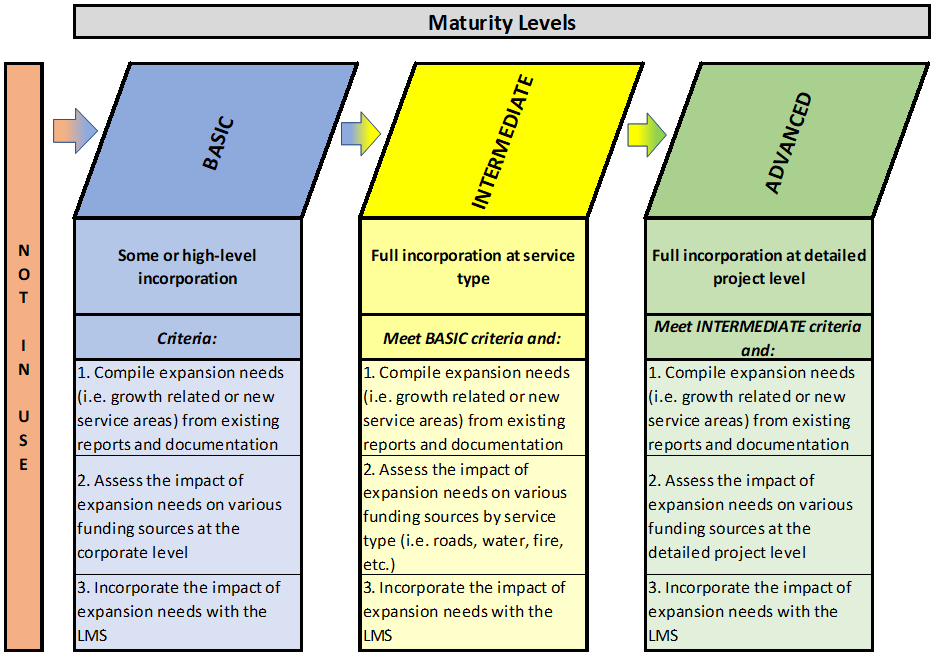
At the basic level of maturity, there will be some
incorporation or high-level incorporation of growth and/or new service areas
into the lifecycle management strategy. Municipalities compile expansion needs
(i.e. growth related or new service areas) from existing reports and
documentation. The impact of these expansion needs on various funding sources is
assessed, but generally at a high level only. The impact of the expansion needs
are incorporated into lifecycle management strategy.
At the intermediate level of maturity, there will be
full incorporation of growth and/or new service areas into the lifecycle
management strategy by service type. Municipalities compile expansion needs
(i.e. growth related or new service areas) from existing reports and
documentation. The impact of these expansion needs on various funding sources is
assessed by service type (i.e. roads, water, fire, etc.). The impact of the
expansion needs is incorporated into lifecycle management strategy.
At the advanced level of maturity, there will be full
incorporation of growth and/or new service areas into the lifecycle management
strategy at the detailed project or asset level. Municipalities compile
expansion needs (i.e. growth related or new service areas) from existing
reports and documentation. The impact of these expansion needs on various
funding sources is assessed at the detailed project level. The impact of the
expansion needs is incorporated into the lifecycle management strategy.
Assets Expansion
Previous sections have detailed elements of lifecycle
costing of existing assets within the context of the lifecycle management
strategy. This section explores how to handle new and/or expanded assets in
regards to upgrading, creating, purchasing, constructing, or receiving
contributed assets (with contributed assets discussed more fully later in this
chapter). As
municipalities grow, become more complex, and receive demands from residents,
expansion-related asset needs become a mechanism for allowing growth to occur
and to provide new or expanded services.
Sources of New and Upgraded Assets
The demand for new assets, or the requirement to upgrade
assets, can come from multiple sources, including:
1. Future Growth
Planning: A process which can identify the need for new or expanded assets
to meet increasing demands of providing existing services to an expanding population.
For example:
·
A requirement to increase the stormwater drainage capacity in a
high growth development area; or
·
The need to increase a two-lane road to a four-lane road due to
traffic congestion as a result of an increase in residents and housing in the
area.
2. Gaps in the
Levels of Service Provided: When comparing current service levels to
expected service levels,it may be determined that new or expanded assets are
necessary. For example:
·
The proposed level of service is to maintain parks every week.
Currently, parks are maintained every 2 weeks. To increase service levels, an
additional mower is needed.
3. Decision to
Provide a New Service: A municipality may decide that a new service is
required within the municipality (or a previously contracted service may become
a direct municipal service), resulting in the need for new or expanded assets
to support this service. For example:
·
A municipality may decide to run and operate their water and
wastewater systems, which was previously a contracted service. This requires
additional vehicles and equipment.
Determining Expansion Needs
Additional assets may be required as a result of the
following expansion-related circumstances:
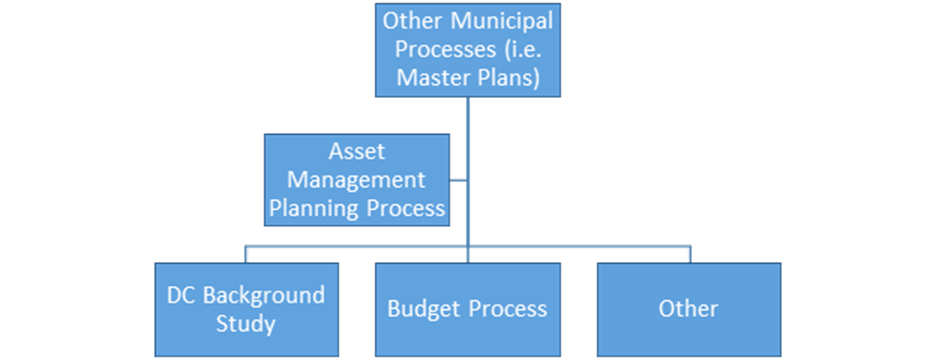
1. Growth
Planning and New Services: Typically, these expansion needs are determined
outside of the asset management planning process. Municipalities will have
other various plans, policies, and strategies that deal with the concept of how
that particular municipality is to grow. This can include:
·
Strategic Plans;
·
Official Plans;
·
Secondary Plans;
·
Master Plans; and
·
Other (i.e. Capital Plans).
As illustrated in Figure 5-8 below, these
plans, policies, and strategies feed growth planning and new service needs into
the asset management process, as well as other processes, such as preparing a
Development Charge (DC) Background Study. It is, then, these other processes,
such as the DC Background Study, that can assist in determining allowable
funding sources within the Financing Strategy (see Chapter 6).
Figure 5‑8
Growth Planning and New Services Process
2.
Gaps in Levels of Service: These expansion needs can come from
the asset management planning process (such as the levels of service analysis –
see Chapter 4), or can be supported by other municipal processes such as
organizational reviews or efficiency/effectiveness reports.
To what extent are contributed assets incorporated into
the lifecycle management strategy?
Background
Municipalities can approach the incorporation of contributed
assets in a number of ways. After compiling details of anticipated contributed
assets from existing reports and documentation, some municipalities will assess
their impact on lifecycle management costs at the corporate level, whereas
others will focus on their impact on the lifecycle management costs by asset
type, or even at a detailed asset level.
Levels of Maturity
To what extent are contributed assets incorporated into
the lifecycle management strategy?
At the basic level of maturity, there will be some
incorporation or high-level incorporation of contributed assets into the
lifecycle management strategy. Municipalities at the basic level of maturity
will compile details of anticipated contributed assets from existing reports
and documentation. The impact on future lifecycle costs of these anticipated
contributed assets is assessed, but generally at the corporate level only. The
impact of the expansion needs is incorporated into the lifecycle management
strategy.
At the intermediate level of maturity, there will be
full incorporation of anticipated contributed assets into the lifecycle
management strategy at the asset type level. Municipalities at the intermediate
level of maturity will compile details of anticipated contributed assets from
existing reports and documentation. The impact of these expansion needs on
future lifecycle costs is assessed by asset type. The impact of the expansion
needs is incorporated into the lifecycle management strategy.
At the advanced level of maturity, there will be full
incorporation of anticipated contributed assets into the lifecycle management
strategy at the detailed asset level. Municipalities at the advanced level of
maturity will compile details of anticipated contributed assets from existing
reports and documentation. The impact of these expansion needs on future
lifecycle costs is assessed at the detailed asset level. The impact of the
expansion needs is incorporated into the lifecycle management strategy.
Contributed Assets
Contributed assets can include:
·
Assets assumed by a municipality, built by a developer (i.e.
completion of a subdivision where roads, stormwater, water, wastewater, parks,
etc. were included in the construction); and
·
Assets donated to a municipality (i.e. a community group), or a
community group agreeing to pay for a portion of an asset’s purchase or
rehabilitation.
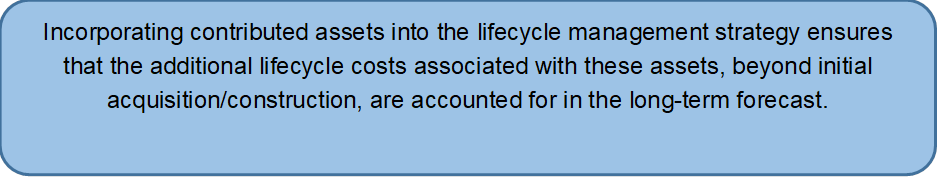
The future lifecycle impact of contributed assets should be
accounted for within the asset management planning process. While the
municipality may not be responsible for the initial purchase or construction of
the asset, other lifecycle costs such as operations, maintenance, and future
rehabilitation or replacement will likely be the responsibility of the
municipality.
Each municipality should identify a consistent approach to accounting
for contributed assets from an asset management perspective. While, for
accounting purposes, these assets don’t have to be recorded until the date of
assumption, asset management consideration can occur before this event, if
desired. If the municipality has the ability to estimate the assets being
contributed (in terms of asset types and date of contribution), these estimates
can be used to start planning for future lifecycle costs within the lifecycle
management strategy (long-term forecast). The municipality’s approach to
determine the specific point in time to account for contributed assets in the
asset management process should be consistently applied, considering options
such as:
·
As soon as the municipality learns of the contributed assets;
·
The year (or year before) the contributed asset is anticipated to
be received/assumed; or
·
As soon as the contributed asset is recorded for accounting
purposes (typically date of assumption/receipt).
For this process to work, effective communication is needed
between municipal departments to ensure future contributed assets can be
identified in an appropriate manner, and at the right point in time.
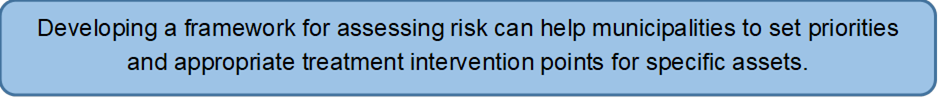
How are risk assessments used within the lifecycle
management strategy?
Background
The previous sections of this chapter dealt with the
lifecycle cost categories that make up the lifecycle management strategy. This
section will explore how risk assessments are used to identify areas for focus
and priorities within the lifecycle management strategy. This will allow a
municipality to effectively mitigate risk while moving towards expected levels
of service from an asset management perspective.
During the management and maintenance of assets there is an
inherent risk associated with each activity. ISO 31000 – Risk management defines
risk as:

Acknowledging risks and managing them appropriately helps to
mitigate any implications associated with that risk, which enables municipal
staff and Council to make informed decisions around how to manage
infrastructure assets and their associated risks.
Levels of Maturity
How are risk assessments used within the lifecycle
management strategy?
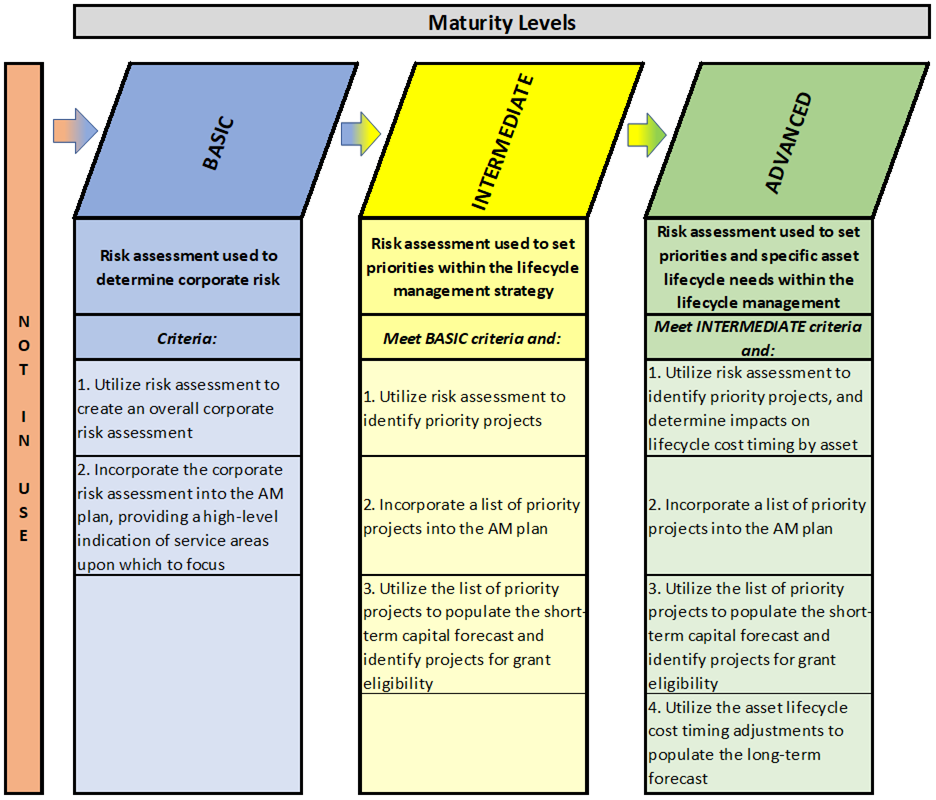
At the basic level of maturity, municipalities use
risk assessment to determine corporate risk by service area. The resulting
corporate risk assessment is incorporated into the asset management plan,
providing a high-level indication of service areas upon which to focus in the
lifecycle management strategy.
At the intermediate level of maturity, risk
assessments are used to set priorities within the lifecycle management
strategy. This is accomplished by utilizing risk assessment to identify
priority projects, and then incorporating the list of priority projects into
the lifecycle management strategy. The list of priority projects is utilized to
populate the short-term capital forecast and to form the basis for determining
grant eligibility.
At the advanced level of maturity, risk assessments
are used to set priorities, as well as specific asset lifecycle needs within
the lifecycle management strategy. Municipalities utilize risk assessments to
identify priority projects, and determine the related impacts on lifecycle cost
timing by specific asset. The list of priority projects is incorporated into
the lifecycle management strategy. The list of priority projects is also used
to populate the short-term to medium-term capital forecast and form the basis
for determining grant eligibility.
Risk Management
Approach
A risk management approach essentially defines what risk
management means to the organization.
For the purposes of asset management, there are two types of
risk:
1. Corporate
Risk: The corporate level risk assessment looks at risks that affect the
organization as a whole.
2. Asset
(Service) Risk: The activity level risk assessment looks at risks affecting
the management of a service and any associated infrastructure. This level of
risk assessment also considers corporate risk and is the level most relevant to
asset management.
One of the first steps in risk management is to understand
the organization and define the risk context. Factors that influence risk
management are identified through this process and a risk tolerance can be
defined.
Three steps can be followed for this process.
1. Conduct a review
that identifies internal and external factors that need to be considered when
managing risks corporately.
2. Determine the
organization’s risk tolerance, which can be expressed from the perspective of
the organization, or for different types of services/risk.
3. Develop an
overall risk management policy statement that is supported by staff and
Council.
In understanding the organization from a risk perspective, a
municipality should be able to describe the risk drivers affecting each service
area. As discussed in Chapter 3, this includes determining the probability of
assets failing as well as the consequence of assets failing, which results in
services “failing”. For services that utilize assets with a high probability
and/or consequence of failure, the minimization of risk can become a significant
objective of asset management planning. Please refer to Chapter 3 for details
on assessing asset risk.
Risk Management
Process
A risk management process is usually established as a
procedure and should be referred to in the asset management planning process
and be integrated into decision-making to assist in mitigating risk.
A risk management process is a series of inter-related steps
that guide the identification, assessment, response, communication, and
monitoring of risks. The risk management process outlined in the Treasury Board
of Canada Secretariat’s (TBS) Guide to Integrated Risk Management
(Section 4.6) is summarized in Figure 5‑9 (below).
Figure 5‑9
Risk Management Process
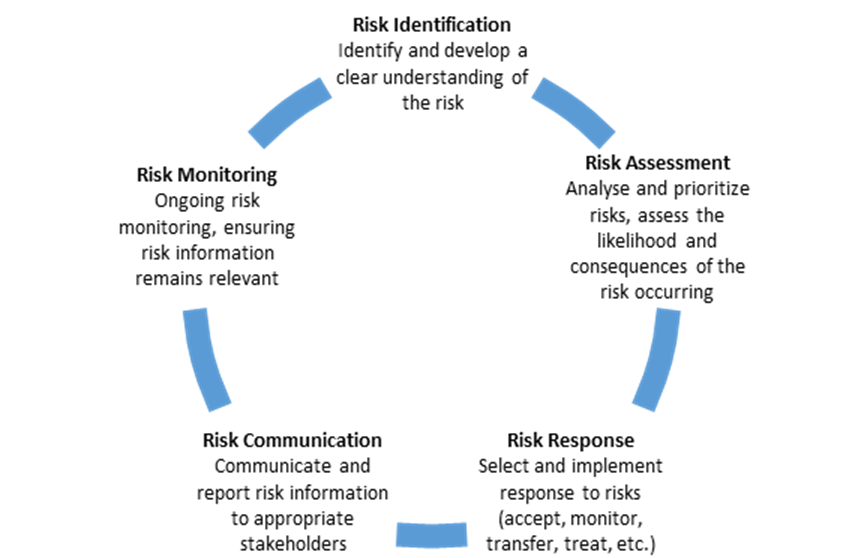
Uncertainty, from a risk perspective, results from a lack of
information or some degree of unpredictability; while an effect is the change
in expected outcomes as a result of something happening. To be effective when
analyzing risks, both the possibility of risks occurring and the uncertainty of
an organization meeting their objectives should have risk treatments applied to
manage risk effects. Actions to minimize negative impacts should be included in
an initial risk assessment to manage effects from possible risks and
uncertainties.
Essentially, this recognizes that whenever one tries to meet
an objective there’s a chance that things won’t go according to plan. There is
always an element of risk and the outcomes are generally uncertain. A
municipality can attempt to mitigate this and reduce uncertainty as much as possible
through risk management.
Risk Assessment
Once the risk management process has been defined, the next
step is to assess which risks are the most severe. An organization can then
determine the level of exposure to each risk, and from there, the actions
necessary from a lifecycle costing perspective to mitigate that risk. From an
asset management perspective, since service levels are directly tied to assets,
risk is applied to specific assets, depending on both probability and
consequence of failure.
As described in Chapter 3, risk can be assessed using a risk
matrix as detailed in Table 5-9 (below), whereby:
 There are also
various deviations from this calculation (as described in Chapter 3), but all
approaches focus on probability and consequence factors.
There are also
various deviations from this calculation (as described in Chapter 3), but all
approaches focus on probability and consequence factors.
Table 5‑9
Risk Assessment Matrix
|
Probability of
Failure
|
Consequence of Failure
|
|
Insignificant
|
Minor
|
Moderate
|
Major
|
Significant
|
|
Rare
|
Low
|
Low
|
Medium
|
Medium
|
High
|
|
Unlikely
|
Low
|
Medium
|
Medium
|
Medium
|
High
|
|
Possible
|
Low
|
Medium
|
Medium
|
High
|
Extreme
|
|
Likely
|
Medium
|
Medium
|
High
|
High
|
Extreme
|
|
Almost Certain
|
Medium
|
High
|
High
|
Extreme
|
Extreme
|
Setting Priorities Using Risk
In previous sections, it was discussed that risk management
and informed decision making are inherently linked. The simplest way to use
risk to set priorities is through a risk matrix similar to the one shown above.
The suggested steps to incorporate risk into the lifecycle management strategy include:
1. Identify the
probability of asset failure;
2. Identify the
consequence of that failure;
3. Combine the
probability and consequence factors to obtain a risk ranking;
4. The asset or
project with the highest risk should be attended to first through some type of
lifecycle activity (non-infrastructure solutions, maintenance, rehabilitation,
replacement, or expansion); and
5. Lifecycle activity
costs identified are included in the lifecycle management strategy.
Please refer to Chapter 3 for more details on this
calculation.
The International Infrastructure Management Manual (IIMM)
provides a good illustration of this process from another perspective, shown
below in Figure 5‑10:
Figure 5‑10
Work Prioritization Based on Risk – IIMM
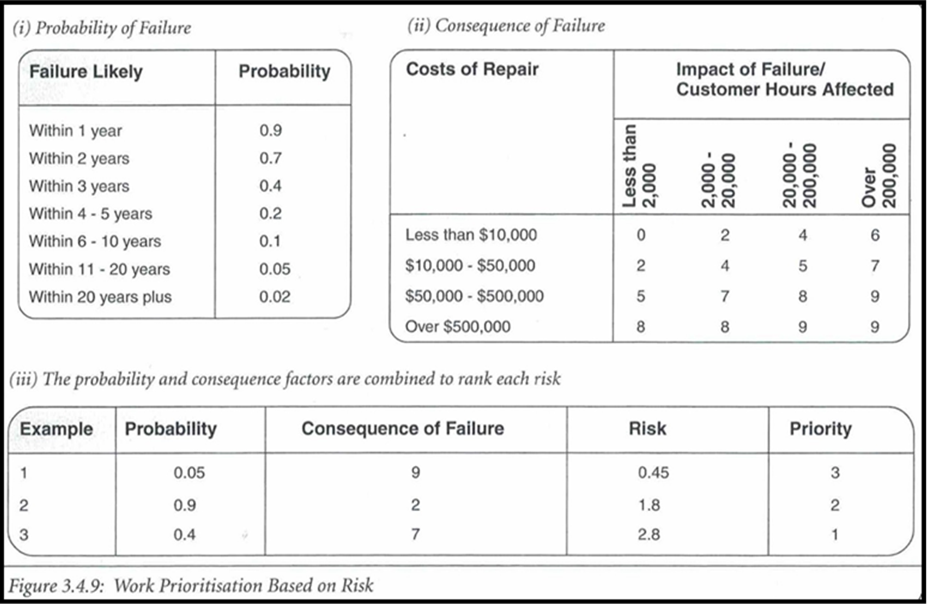

Has the municipality considered multiple lifecycle
management strategy scenarios within its asset management plan?
Background
Municipalities can benefit from considering multiple
lifecycle management strategy scenarios within their asset management plan. Comparing
lifecycle cost forecasts versus asset performance (or service levels) over time
for alternative strategies can assist municipalities to ensure that the most
beneficial strategies are implemented.
Levels of Maturity
Has the municipality considered multiple lifecycle
management strategy scenarios within its asset management plan?
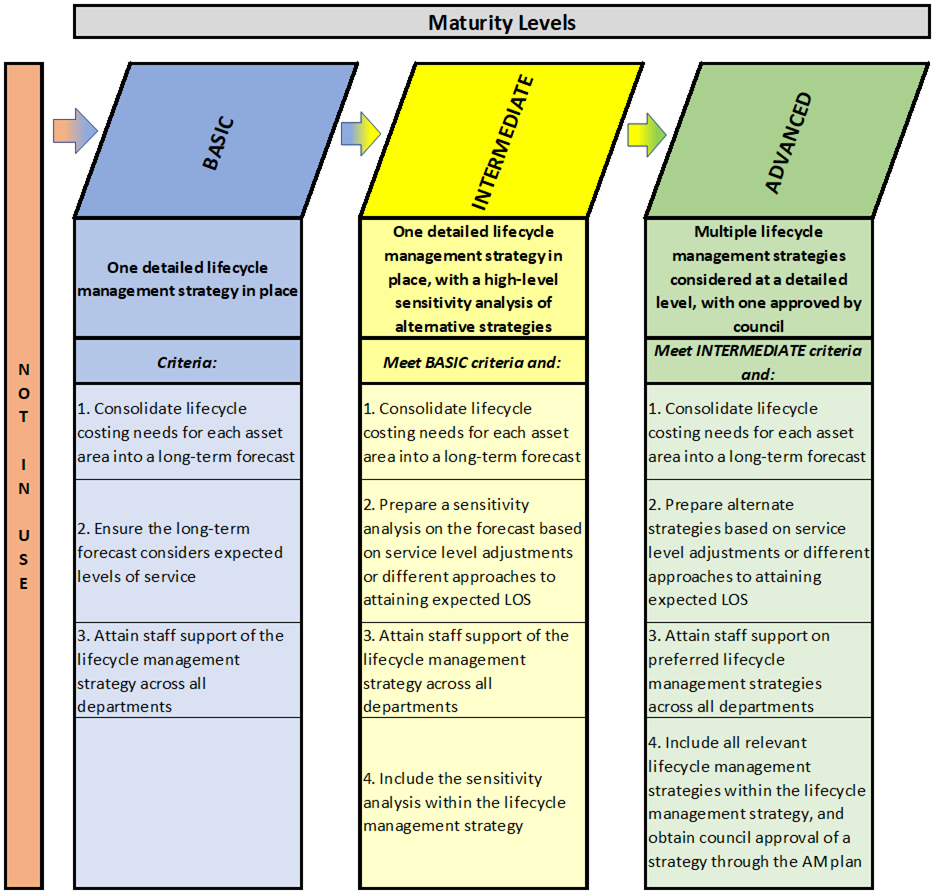
At the basic level of maturity, municipalities will
typically have one detailed lifecycle management strategy in place. Lifecycle
costing needs for each asset area are consolidated into a long-term forecast.
The long-term forecast is developed with consideration for expected levels of
service. Staff support for the lifecycle management strategy should be attained
across all departments.
At the intermediate level of maturity, municipalities
will have one detailed lifecycle management strategy supplemented by a
high-level sensitivity analysis of alternative strategies. Lifecycle costing
needs for each asset area are consolidated into a long-term forecast. A
sensitivity analysis on the forecast is prepared based on service level
adjustments, or alternative lifecycle costing approaches to achieving expected
levels of service. Staff support for the lifecycle management strategy should
be attained across all departments. The sensitivity analysis will form part of
the lifecycle management strategy.
At the advanced level of maturity, multiple lifecycle
management strategy scenarios are considered at a detailed level. Alternative
strategies are prepared based on service level adjustments, or alternative lifecycle
costing approaches to achieving expected levels of service. Lifecycle costing
needs for each asset area are consolidated into long-term forecasts (one for
each scenario). Staff support for the preferred lifecycle management strategy
should be attained across all departments. All relevant strategy scenarios is
included within the lifecycle management strategy, and Council approval of
preferred scenarios should be obtained through the asset management plan.
Determining
Lifecycle Management Strategy Scenarios
 An
optimal lifecycle management strategy would entail finding the most
efficient/effective approach to managing assets throughout their life. The
assets should be used in such a manner as to be as cost effective as possible
(considering lifecycle costs), while delivering expected levels of service and
mitigating risk. To facilitate this strategy, municipalities need to predict
what lifecycle costs are needed, and when, including:
An
optimal lifecycle management strategy would entail finding the most
efficient/effective approach to managing assets throughout their life. The
assets should be used in such a manner as to be as cost effective as possible
(considering lifecycle costs), while delivering expected levels of service and
mitigating risk. To facilitate this strategy, municipalities need to predict
what lifecycle costs are needed, and when, including:
·
Non-infrastructure solutions;
·
Maintenance and operations;
·
Rehabilitation;
·
Replacement and disposal; and
·
Expansion.
Figure 5‑11 (below) represents a sample asset’s
lifecycle. The degradation line (green) depicts the performance/ condition
levels at various stages throughout the asset’ life. As expected, the performance/condition
of the asset reduces as time passes. Scheduled condition assessments can
provide important insights into the degradation curve.
Figure 5‑11
Sample Asset Lifecycle with Planned Intervention
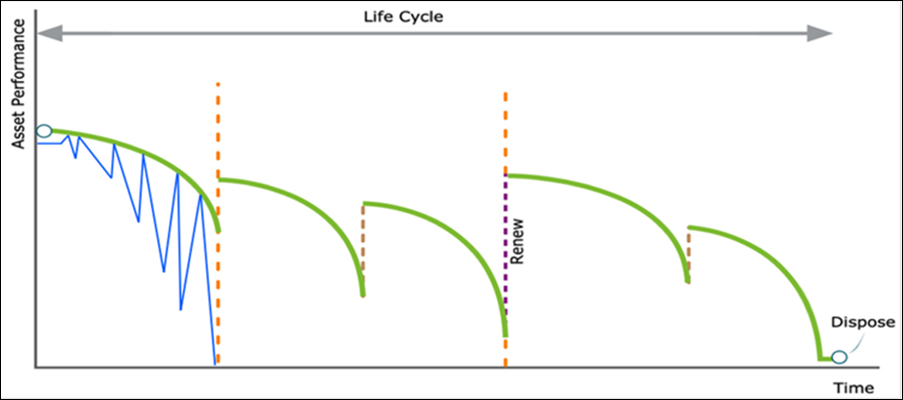
The blue line represents maintenance completed in the first
segment of the graph (in reality this would continue over the entire life of
the asset). The length of the blue lines represents the amount of maintenance
required as the asset deteriorates. As the degradation curve slopes down on the
Asset Performance axis, the total amount of maintenance increases.
The dashed lines (orange) represent asset renewal and
rehabilitation. These types of activities enhance the asset’s performance and
service life. This is evidenced by the position of the degradation curve
immediately following the dashed lines along the Time axis. By actively
managing the lifecycle management strategy for this asset, it has had its
performance and service life maximized. However, eventually, the asset is
disposed of and replaced. Creating an optimal lifecycle management strategy
entails this type of analysis for all assets of the municipality.
Table 5‑10 (below) outlines a number of approaches
available for municipalities, when considering how to manage a particular
asset’s lifecycle needs.
Table 5‑10
Sample Lifecycle Management Scenarios
|
|
Strategy
|
Considerations
|
|
Asset Based Solutions
|
Do nothing
|
Always consider 'doing nothing' as an option. This position would
be the baseline against which other options are compared. In some cases, risk
levels or levels of service requirements offer 'do nothing' as a legitimate
alternative.
|
|
Operational procedures
|
Operational management changes to limit peak demand, such as
minimizing leakage (i.e. water), or modifying schedules for use of an asset,
could be employed. Contingency plans can improve recovery times and reduce
impacts of failure.
|
|
Maintenance procedures
|
The level and timing of maintenance can improve asset performance
and/or extend its useful life.
|
|
Asset rehabilitation/renewal
|
Depending upon where an asset is on its lifecycle, rehabilitation
may be an option to maintain service levels, or extend service life.
|
|
Expansion
|
Where demand exists, investment may be required to create new
assets, or to augment/enhance existing ones.
|
|
Asset replacement/disposal
|
An asset which is no longer providing adequate service levels may
have to be disposed of and replaced, or reconfigured to meet alternative
business needs.
|
|
Non-Asset Based Solutions
|
Reduce demand for service
|
Strategies to reduce demand can be employed such as pricing
incentives and provision of alternative services (i.e. promote several
parks).
|
|
Reduce levels of service
|
Accept lower levels of service for certain identified assets (i.e.
pavement surfaces could be allowed to deteriorate to a lower condition level
for certain local roads).
|
|
Educate customers
|
Use communication/information to allow customers to manage their
use of assets (i.e. carpooling or water conservation) and their expectations
of asset performance and failure rates.
|
Comparing Lifecycle Scenarios: Net
Present Value
With multiple lifecycle management scenarios possible within
an asset management plan, a methodology is required to compare these scenarios
to determine the scenario with the “lowest lifecycle cost”. One possible
methodology is a net present value analysis.
The timing and cost of interventions and maintenance, and
therefore the real lifecycle costs, are impacted by the time value of money. In
simple terms, this means that to be able to have $1.00 to spend in the future,
you would have to invest less than $1.00 today. As a result, to compare future
expenditures over a lifecycle, the value of all expenditures need to be
discounted back to a current-day value. This is called Net Present Value (NPV),
also known as Net Present Worth (NPW).
The formula for NPV is:
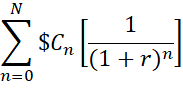
Where:
·
 year
year  of the analysis period;
·
 the number of years in the analysis
period;
the number of years in the analysis
period;
·
 the cost in year
  ;
;
·
 the discount (inflation) rate as a
decimal (e.g. 0.03 for 3%); and
the discount (inflation) rate as a
decimal (e.g. 0.03 for 3%); and
·
 the number of years into the future from
year .
the number of years into the future from
year .
NPV is used to compare strategies that have the same duration
(i.e. 2 scenarios that cover a 20-year forecast period). Applying the concept
of NPV assists in determining the scenario with the lowest lifecycle cost. From
a common-sense point of view, this approach is taking the inflated lifecycle
costs in each year of the forecast and deflating them to put all into current
year terms. In the example below, Table 5‑11, scenario 1 and scenario 2
have the same inflated lifecycle costs over the 5-year forecast ($400,000),
however scenario 2 has a lower NPV.
Table 5‑11
Sample Net Present Value Scenarios
|
year
|
0
|
1
|
2
|
3
|
4
|
5
|
TOTAL
|
|
Scenario 1 Inflated
|
|
50,000
|
65,000
|
80,000
|
95,000
|
110,000
|
400,000
|
|
Scenario 1 NPV (yr = 0)
|
|
48,544
|
61,269
|
73,211
|
84,406
|
94,887
|
362,317
|
|
Scenario 2 Inflated
|
|
40,000
|
45,000
|
60,000
|
130,000
|
125,000
|
400,000
|
|
Scenario 2 NPV (yr = 0)
|
|
38,835
|
42,417
|
54,908
|
115,503
|
107,826
|
359,490
|
Therefore, creating and selecting
lifecycle management scenarios entails looking at many objectives, such as:
·
The levels of service provided;
·
The risk being mitigated; and
·
Minimizing lifecycle costs in current year dollars (i.e. through
NPV calculations).
Why Optimize?
Municipalities must make good decisions as to how, where,
and when they spend the limited funds available for infrastructure (capital and
operating). This means gaining the most benefit from capital expenditure and
minimizing maintenance costs without compromising service or risk levels over a
long period. Therefore, a primary objective of asset management planning is to
achieve the best cost versus service outcome.
There are numerous asset management software packages that
use deterministic, and/or probabilistic, techniques to model asset behaviour to
predict future capital and operating budgets as well as asset condition. Many
asset management software packages also include the ability to optimize aspects
such as cost, risk, and other benefits. Concepts of modelling optimization are
dealt with in more detail in Chapter 9.
What is Optimal?
Optimal outcomes for asset managers can mean different
things. In previous sections of this chapter, lifecycle costing types were
discussed. The lowest lifecycle cost could be termed as an optimal outcome from
a finance point of view. If, however, the lowest lifecycle cost strategy does
not deliver satisfactory levels of service, it would be a sub-optimal outcome
from the customer’s point of view.
This is demonstrated by Figure 5‑12 below. The figure
is based on the theory used by most modelling tools that costs are high to support
a network in poor condition due to higher maintenance costs. Further,
maintaining a network in very good condition also leads to high costs due to
the need for more frequent renewal. Under this concept, the optimal cost level
will be at some point between good and poor condition (the lowest point of the
curve). The condition that correlates to that cost, however, may not be
acceptable. So, a sub-optimal cost would be arrived at for the desired
condition.
Figure 5‑12
Lifecycle Management Scenarios – Optimal
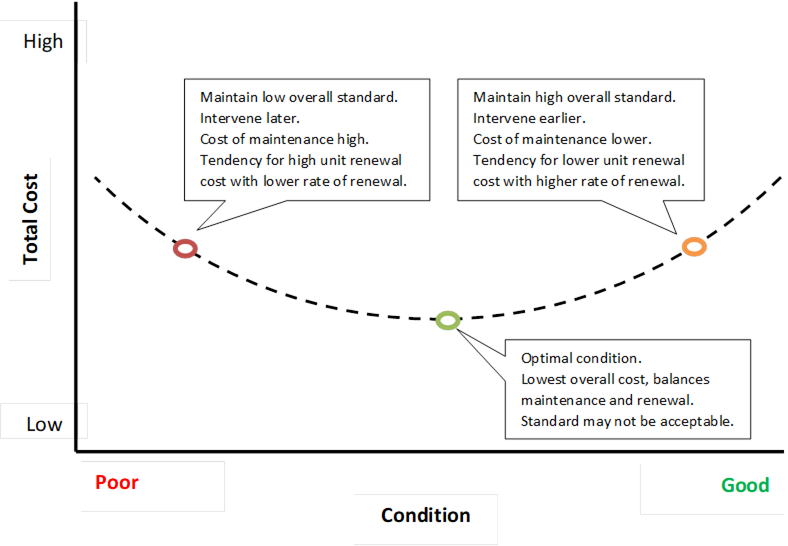
Essentially, what asset managers should be striving for are
levels of service that are either at the optimal point, or somewhere to the
right of optimal, based on the example above.
Optimization is often constrained by available funding. For
instance, it is not possible to fully optimize a condition outcome if funds are
insufficient for the total maintenance and capital required. In these
circumstances, the optimization will likely be the achievement the best all-round
service outcome with the limited funding and involves balancing maintenance and
capital costs with a number of benefits related to condition, risk, and other
service aspects.
Typically, when using predictive modelling tools and
optimization, a number of scenarios should be developed to evaluate differing
funding levels and timing, differing service targets, and trade-offs between
funding and service. After evaluation, a final scenario will be adopted as the
preferred lifecycle management strategy.
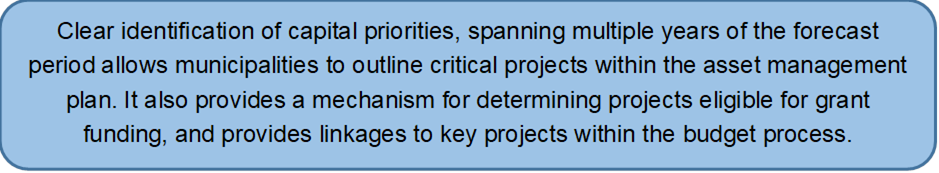
Are clear capital priorities established within the
lifecycle management strategy?
Background
Capital investment is typically a combination of capital
asset rehabilitations, replacements, and expansions. A methodology was
introduced in the risk discussion in the section above that can assist
municipalities to establish clear priorities based on a risk management
approach. The clear identification of capital priorities is critical for the
lifecycle management strategy, as it is a prerequisite for provincial grant
funding applications and federal gas tax funding reporting.
Levels of Maturity
Are clear capital priorities established within the
lifecycle management strategy?
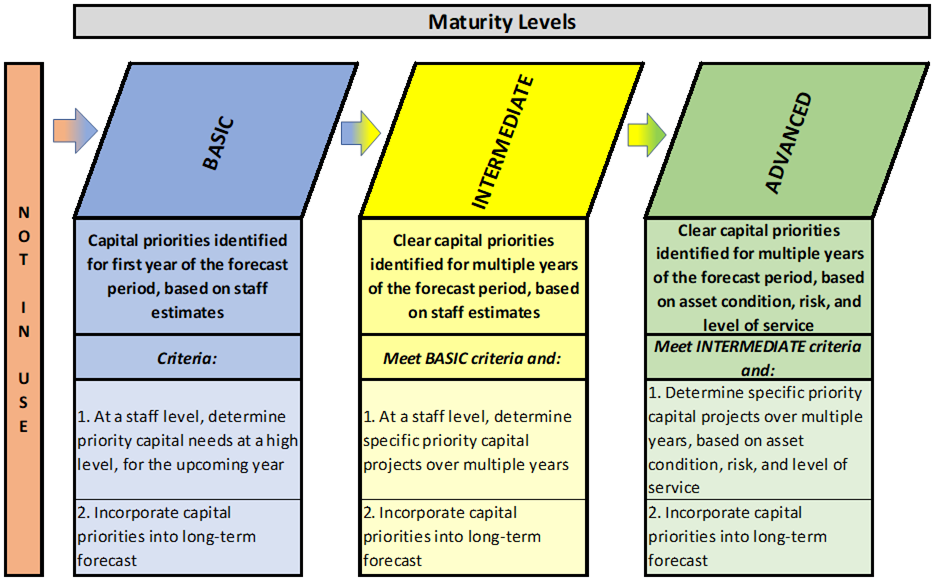
At the basic level of maturity, municipalities will
identify capital priorities for the first year of the forecast period only.
Typically, at this level of maturity, this is done at a high level, based on
staff estimates rather than a more documented and defined approach. The
priorities are included in the first year of the lifecycle management strategy
and identified as priorities within the asset management plan.
At the intermediate level of maturity, municipal
staff will clearly determine specific priority capital projects over multiple
years. Staff estimates are used as a foundation for the priority capital spending
identification, which is documented by project or asset. This process is
undertaken based on staff estimates rather than a more documented and defined
approach. The priorities are included in the lifecycle management strategy and
identified as priorities within the asset management plan.
At the advanced level of maturity, specific capital
priorities are determined based on an assessment of asset needs in regards to
condition, risk, and levels of service (i.e. documented and defined approach,
such as risk management based). The priorities are included in the lifecycle
management strategy and identified as priorities within the asset management
plan.
Identifying Capital
Priorities
Capital projects to be identified for current or future
attention can come from a number of sources. The following list provides some
areas of consideration:
· Risk
Management Assessments: Identify assets (or service areas) with high risk
of failure with the intent of mitigating risk, while providing expected levels
of service;
· Future
Expansion Planning: Identify areas where current asset capabilities will be
insufficient to deliver expected levels of service, resulting in the
identification of expansion-related priorities;
· Asset
Lifecycle Analysis: Replacement/rehabilitation scenario models may identify
assets as priorities (based on asset condition), in accordance with lowest
lifecycle costs;
· Asset
Obsolescence: Assets that no longer provide levels of service, or can no
longer be maintained, rehabilitated or replaced given obsolescence, may be
identified as priority projects;
· Technological
Advancements: Opportunities may arise to deliver better service levels at a
lower lifecycle cost;
· Operational:
Municipal staff may identify potential priority projects to reduce asset
operational costs; and
· Land-use
Plan: Land-use planning may present new opportunities for existing assets
or identify priority projects.
Depending on the availability of resources and/or the
sophistication of asset management processes and tools, a municipality may
prioritize decisions at the individual asset level, or at the asset type level.
The latter approach will require some generalized assumptions to be made and
followed for all assets of that asset type. This will potentially result in a
lesser degree of accuracy than under the individual asset approach. However,
making rehabilitation decisions at the asset type level can be appropriate for lower
cost assets, where the cost of collecting individual cost information is not
warranted, or reasonably attainable.
Examples:
Table 5‑12
Asset Priority – Level of Detail
|
Level
|
Priority Project
|
|
Asset Type Level
|
Arterial Road Reconstruction Program
|
|
Individual Asset Level
|
Smith Street Reconstruction
|
From an asset management plan
perspective, it is suggested that a subsection of the lifecycle management
strategy be dedicated to discussing and identifying priorities. This subsection
provides a clear and transparent priority identification for:
· Future
budget consideration;
· Gas
tax funding consideration; and
· Potential
capital grant application process.
Government of Canada, 2016, Treasury
Board of Canada Secretariat Organization, Guide to Integrated Risk Management, https://www.canada.ca/en/treasury-board-secretariat/corporate/risk-management/guide-integrated-risk-management.html
Institute of Public Works Engineering Australasia, 2015,
International Infrastructure Management Manual, https://www.ipwea.org/publications/bookshop/ipweabookshop/iimm
Province of Ontario, Ministry of Infrastructure, 2012,
Building Together: Guide for Municipal Asset Management Plans, https://www.ontario.ca/page/building-together-guide-municipal-asset-management-plans
Public Sector Accounting Board, 2006, PS 3150 Tangible
Capital Assets